Twinleaf App
A native app for viewing, plotting, and recording live data from Twinleaf sensors. Runs on macOS, iPad, and iPhone.
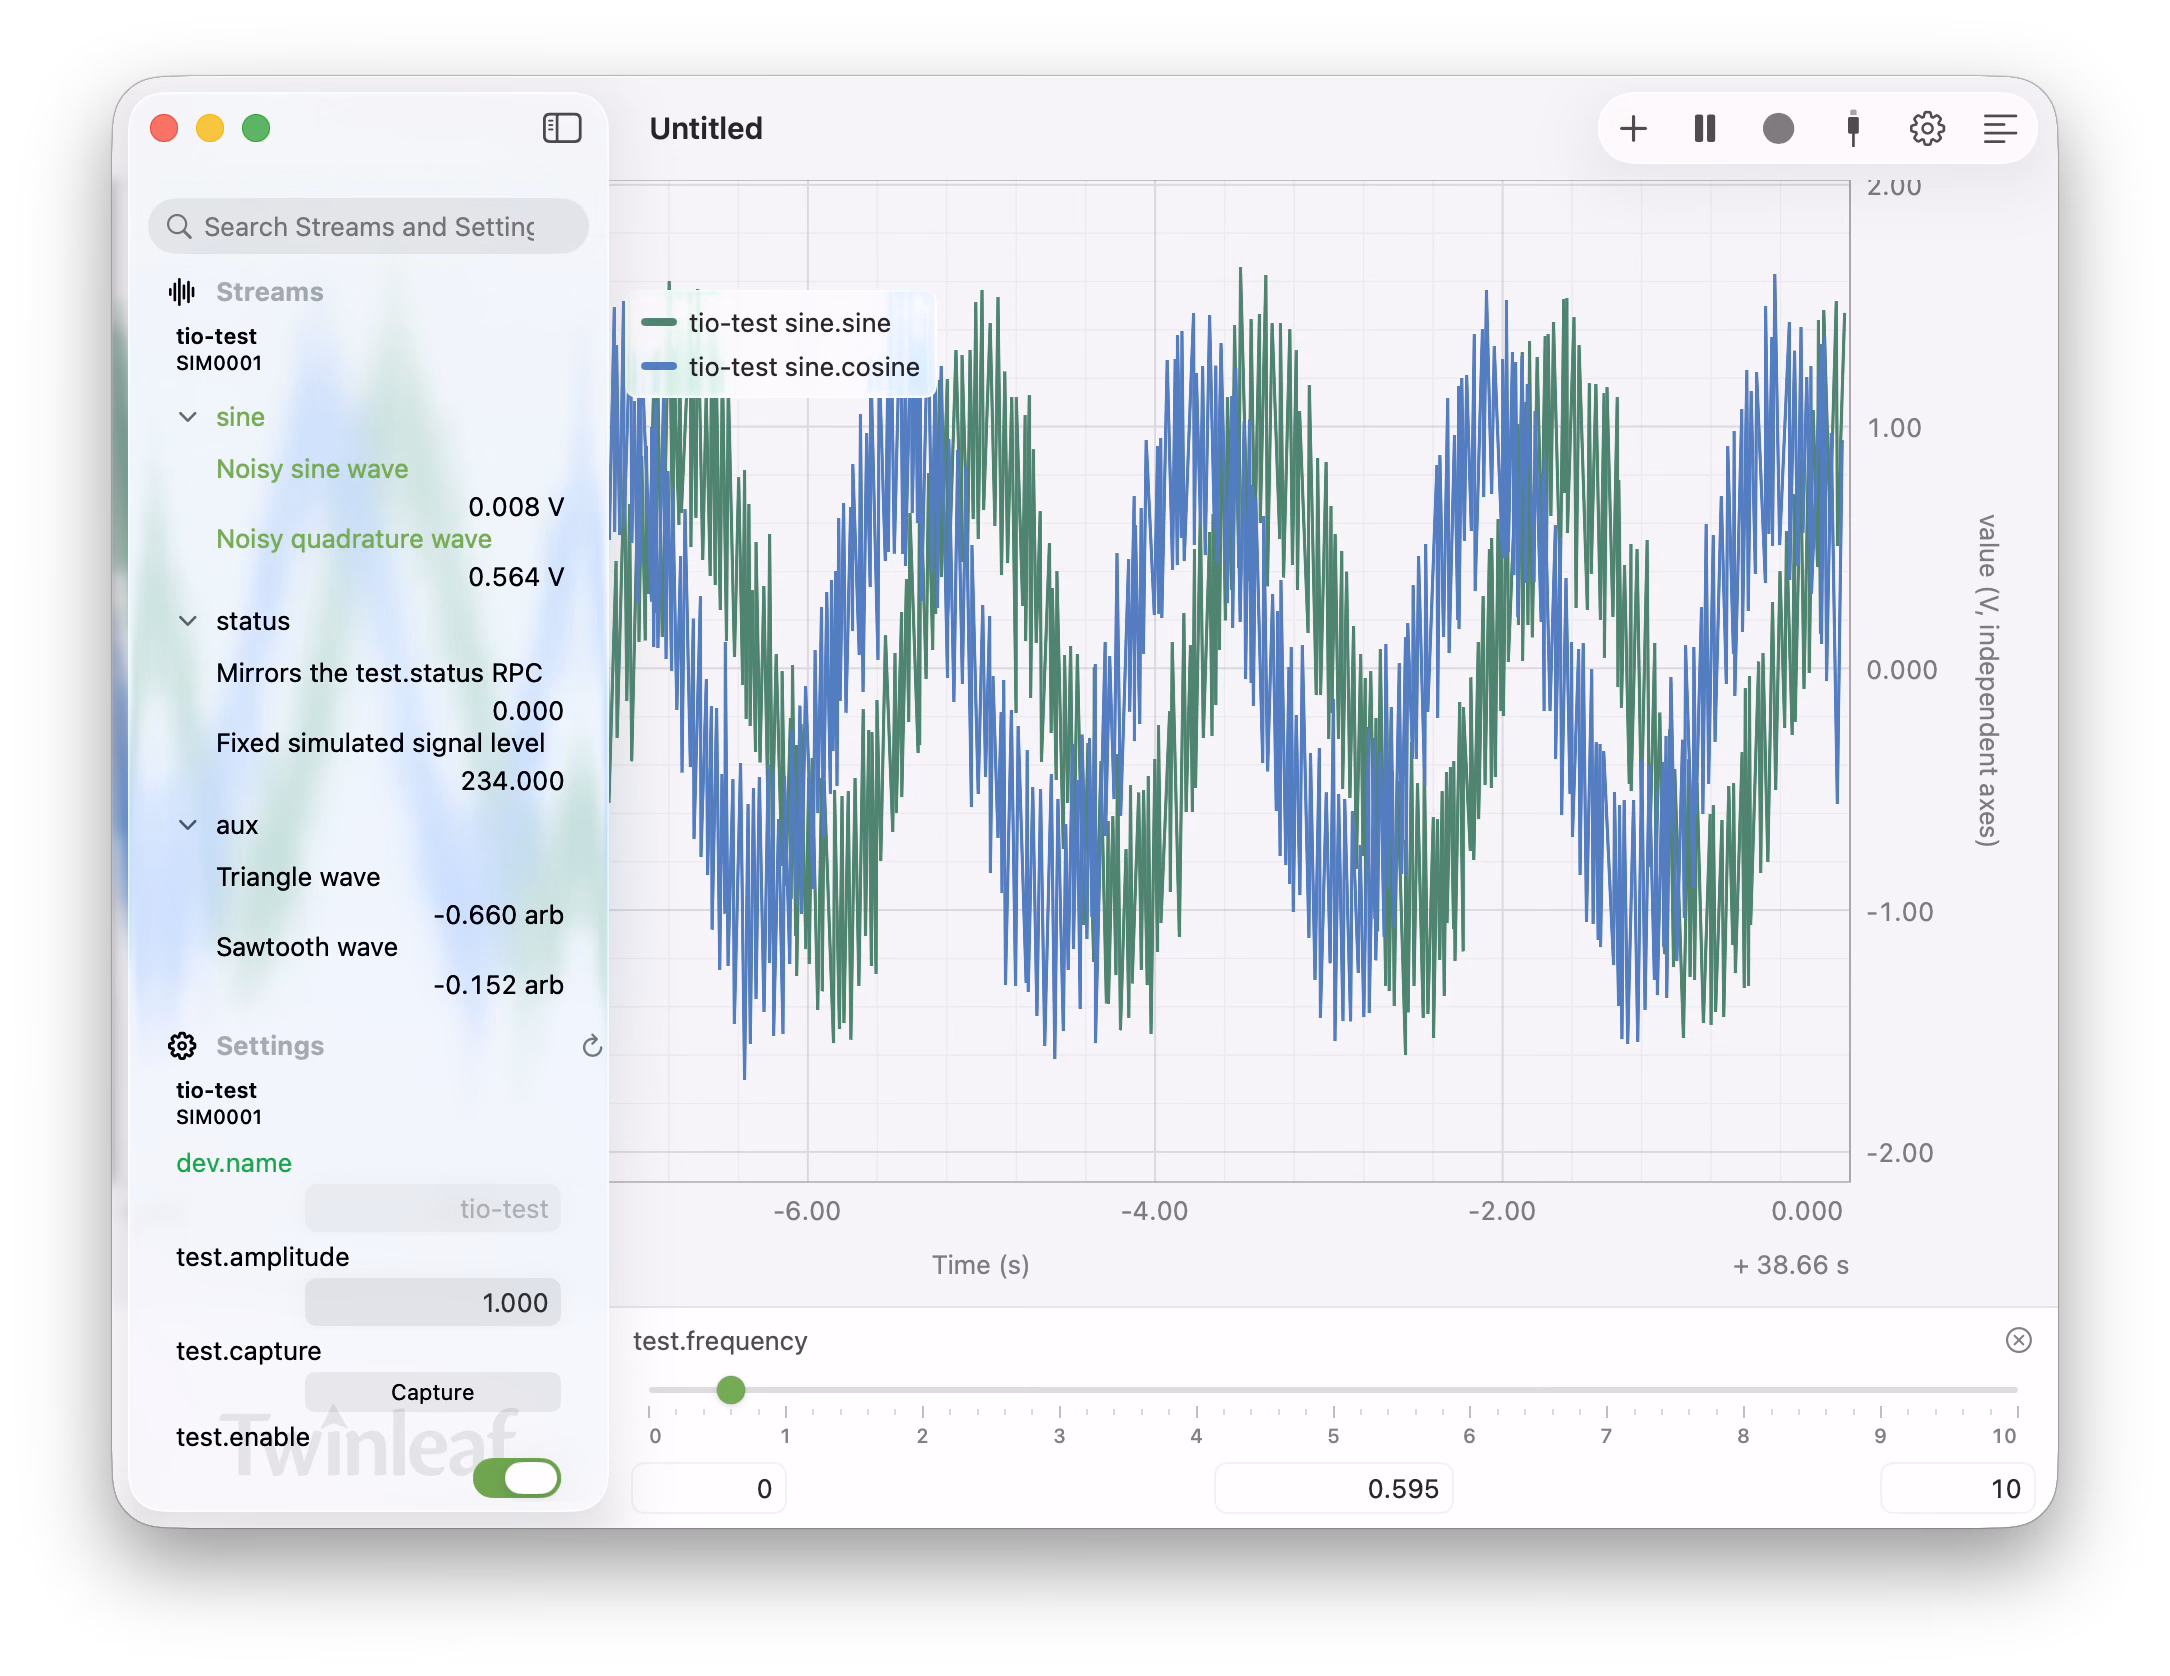
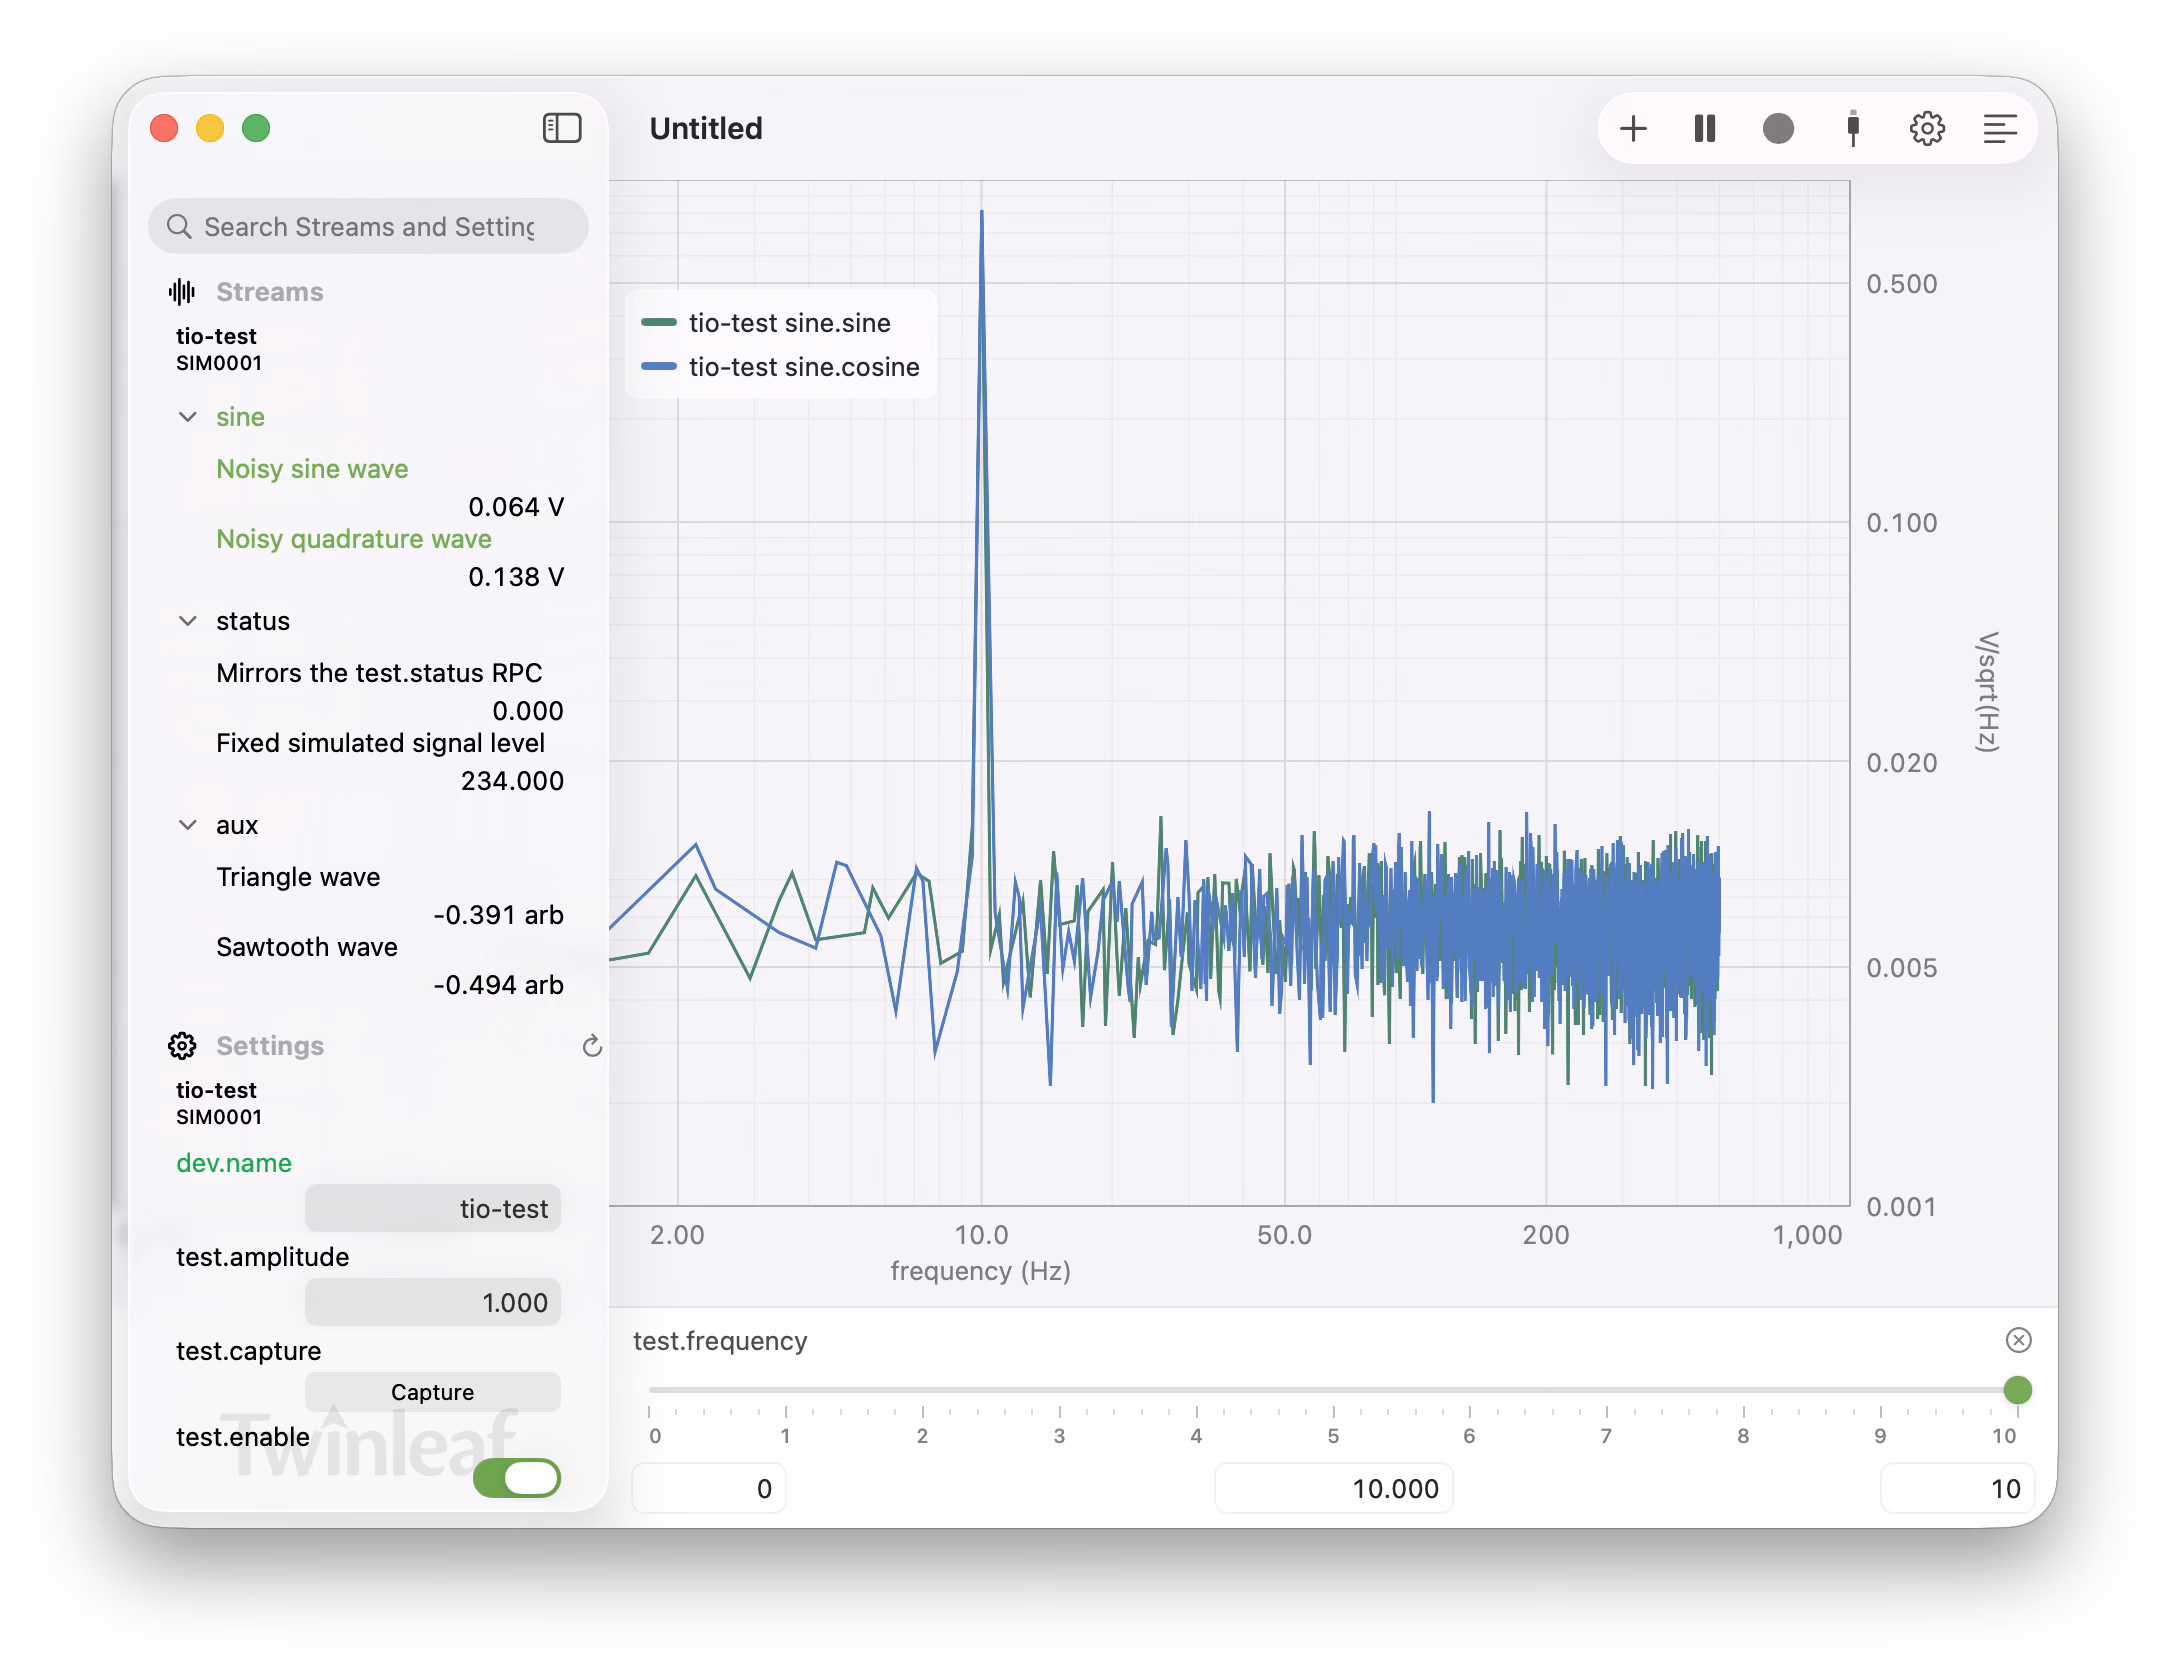
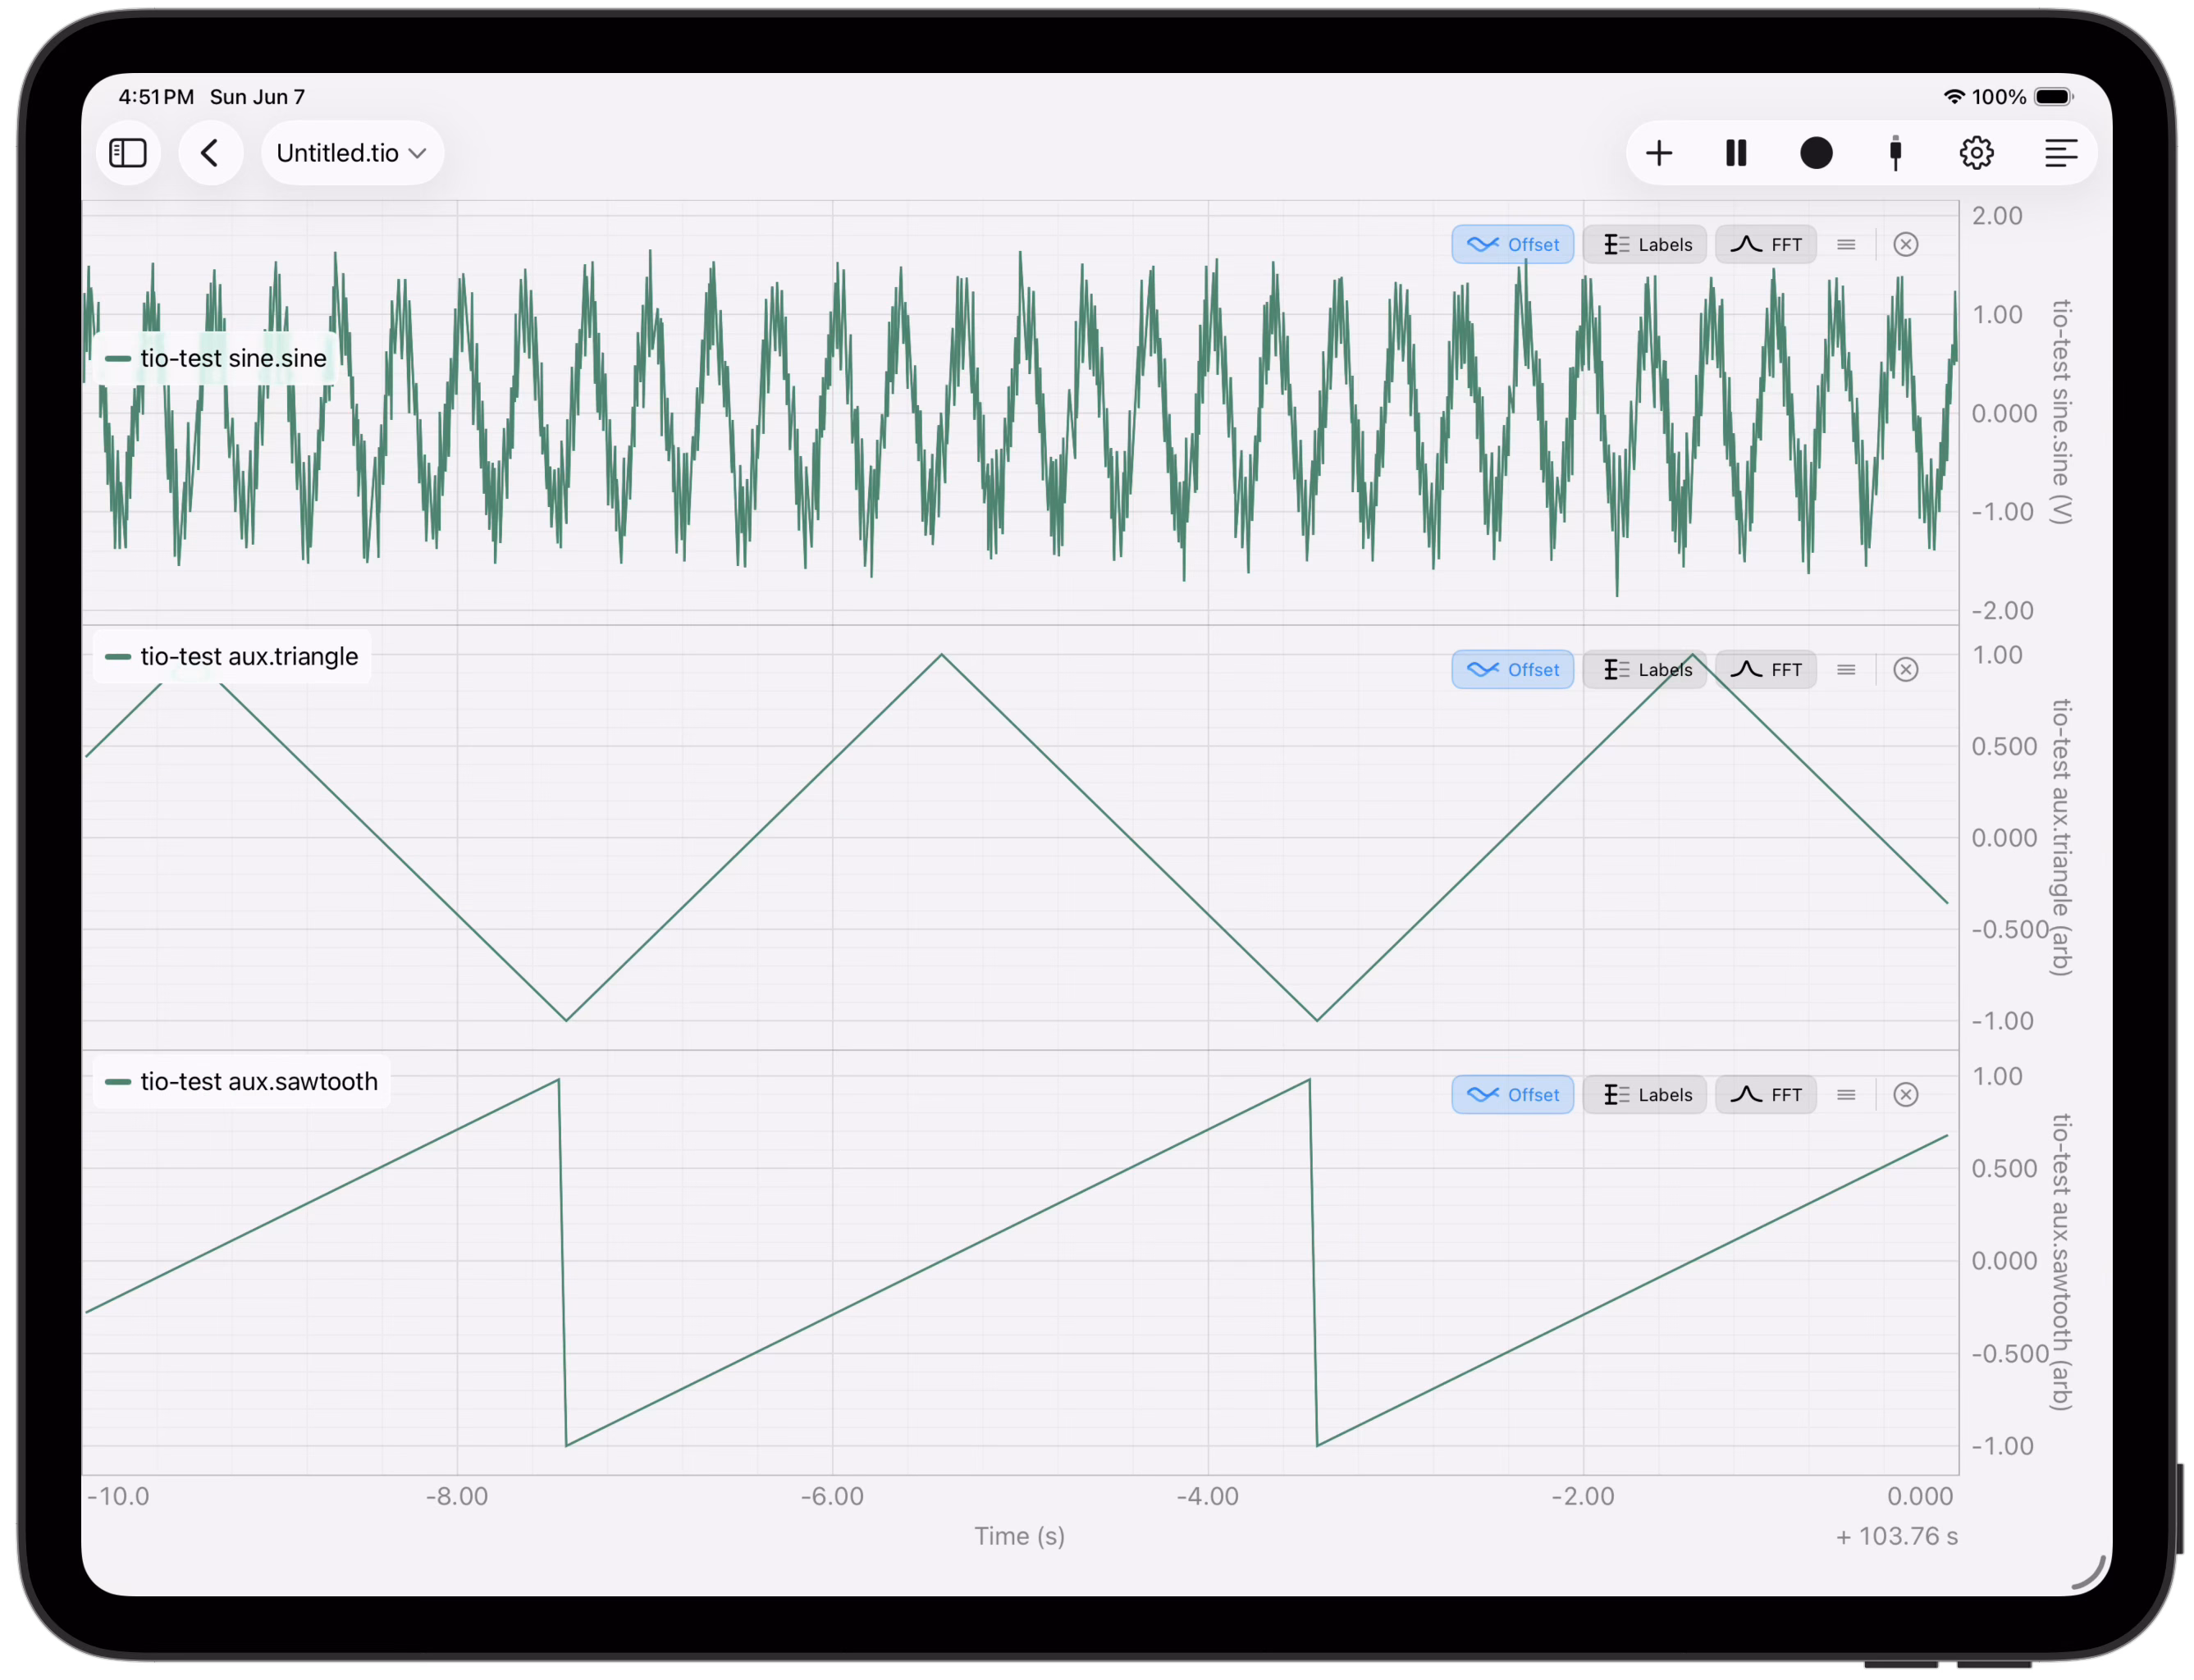
Real-time plotting. Configure axes, group channels, and adjust the time window from one second up to thousands of seconds.
Download
Twinleaf for macOS (8.6 MB) — Apple Silicon macOS 26 or later.
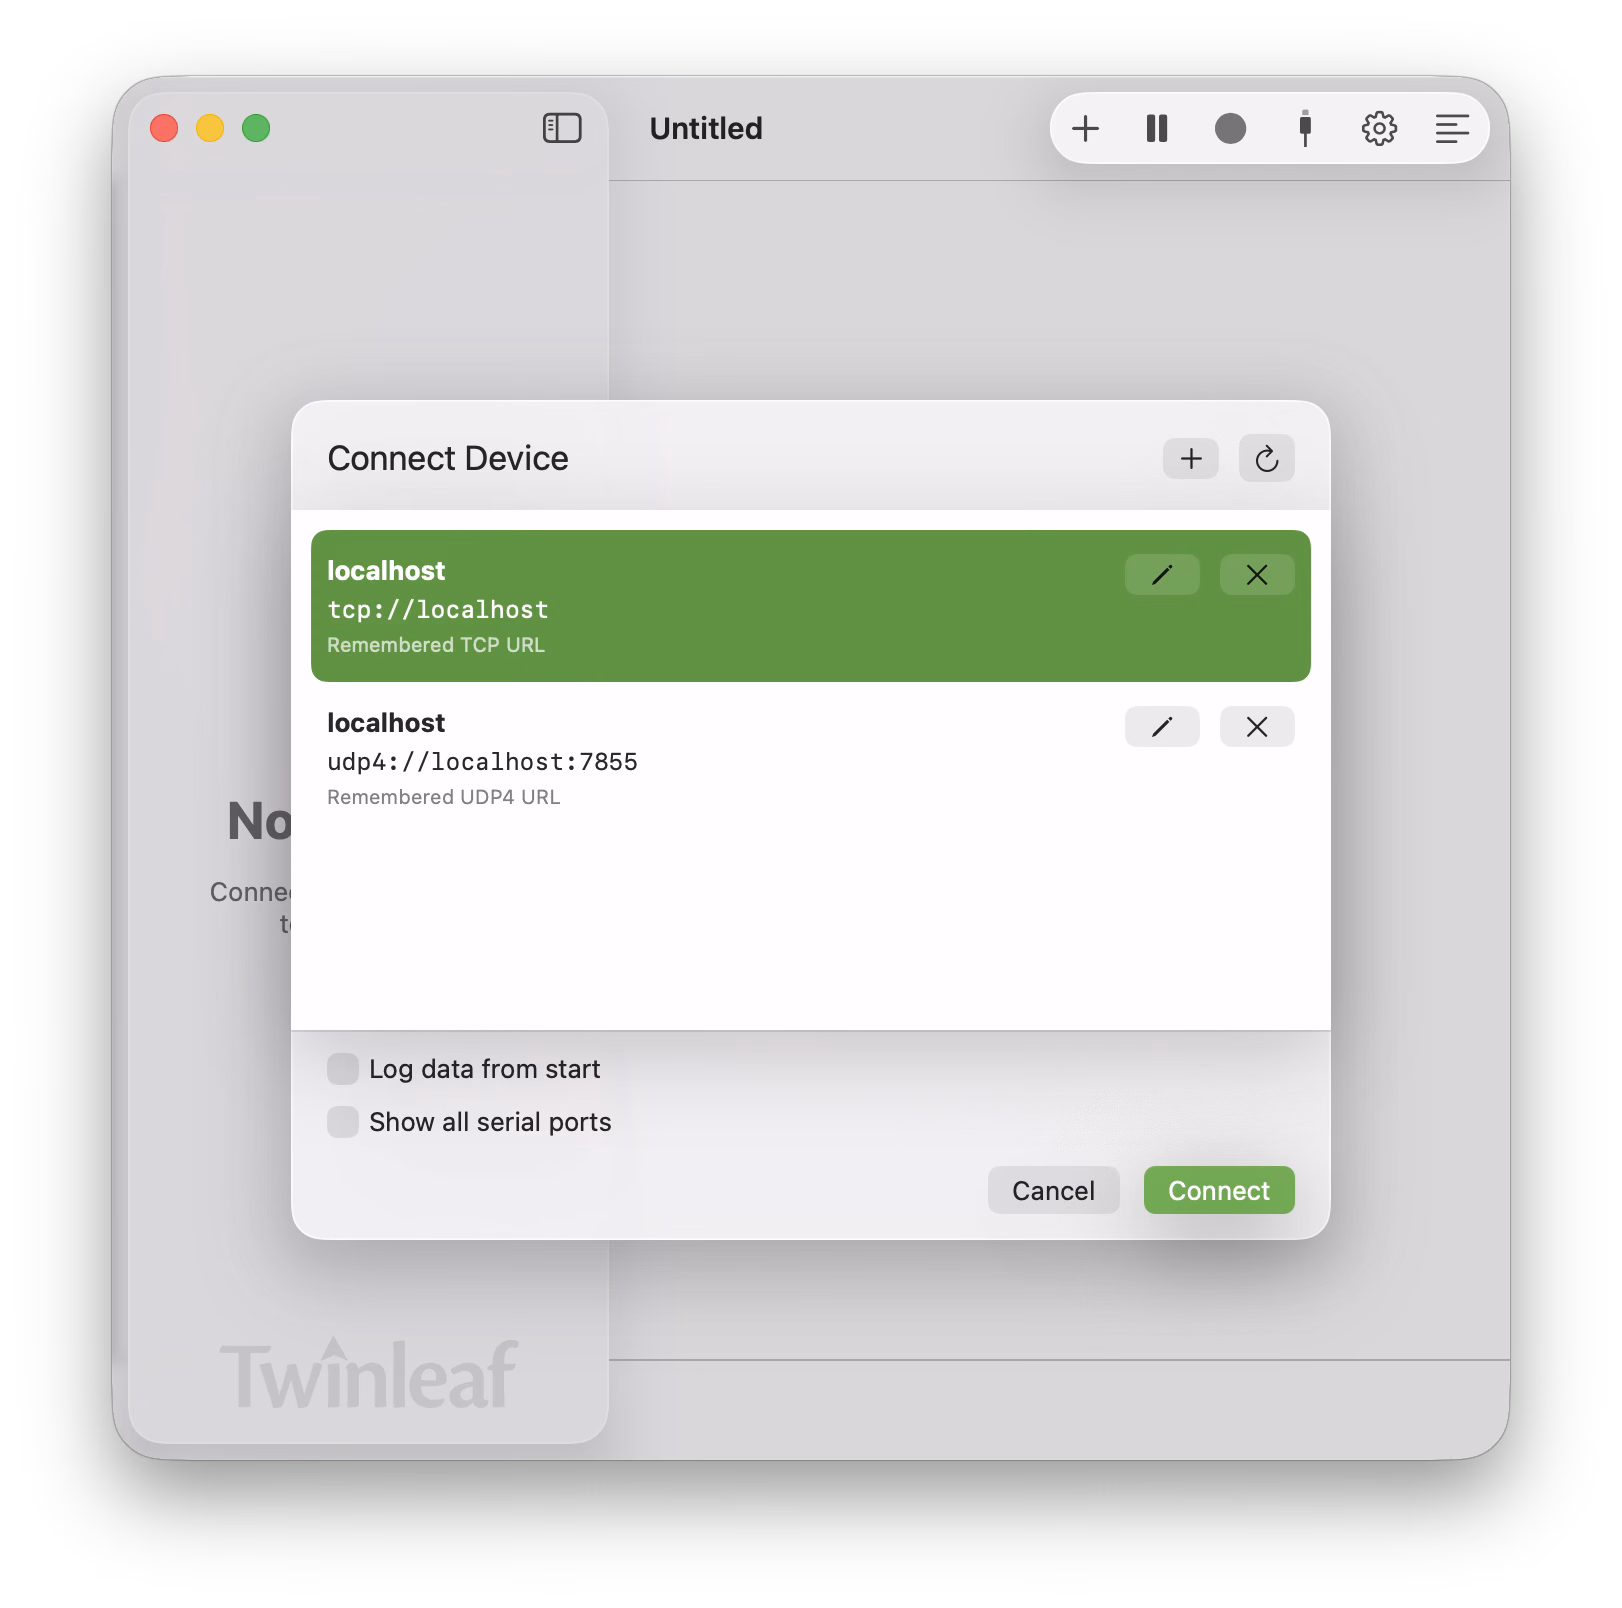
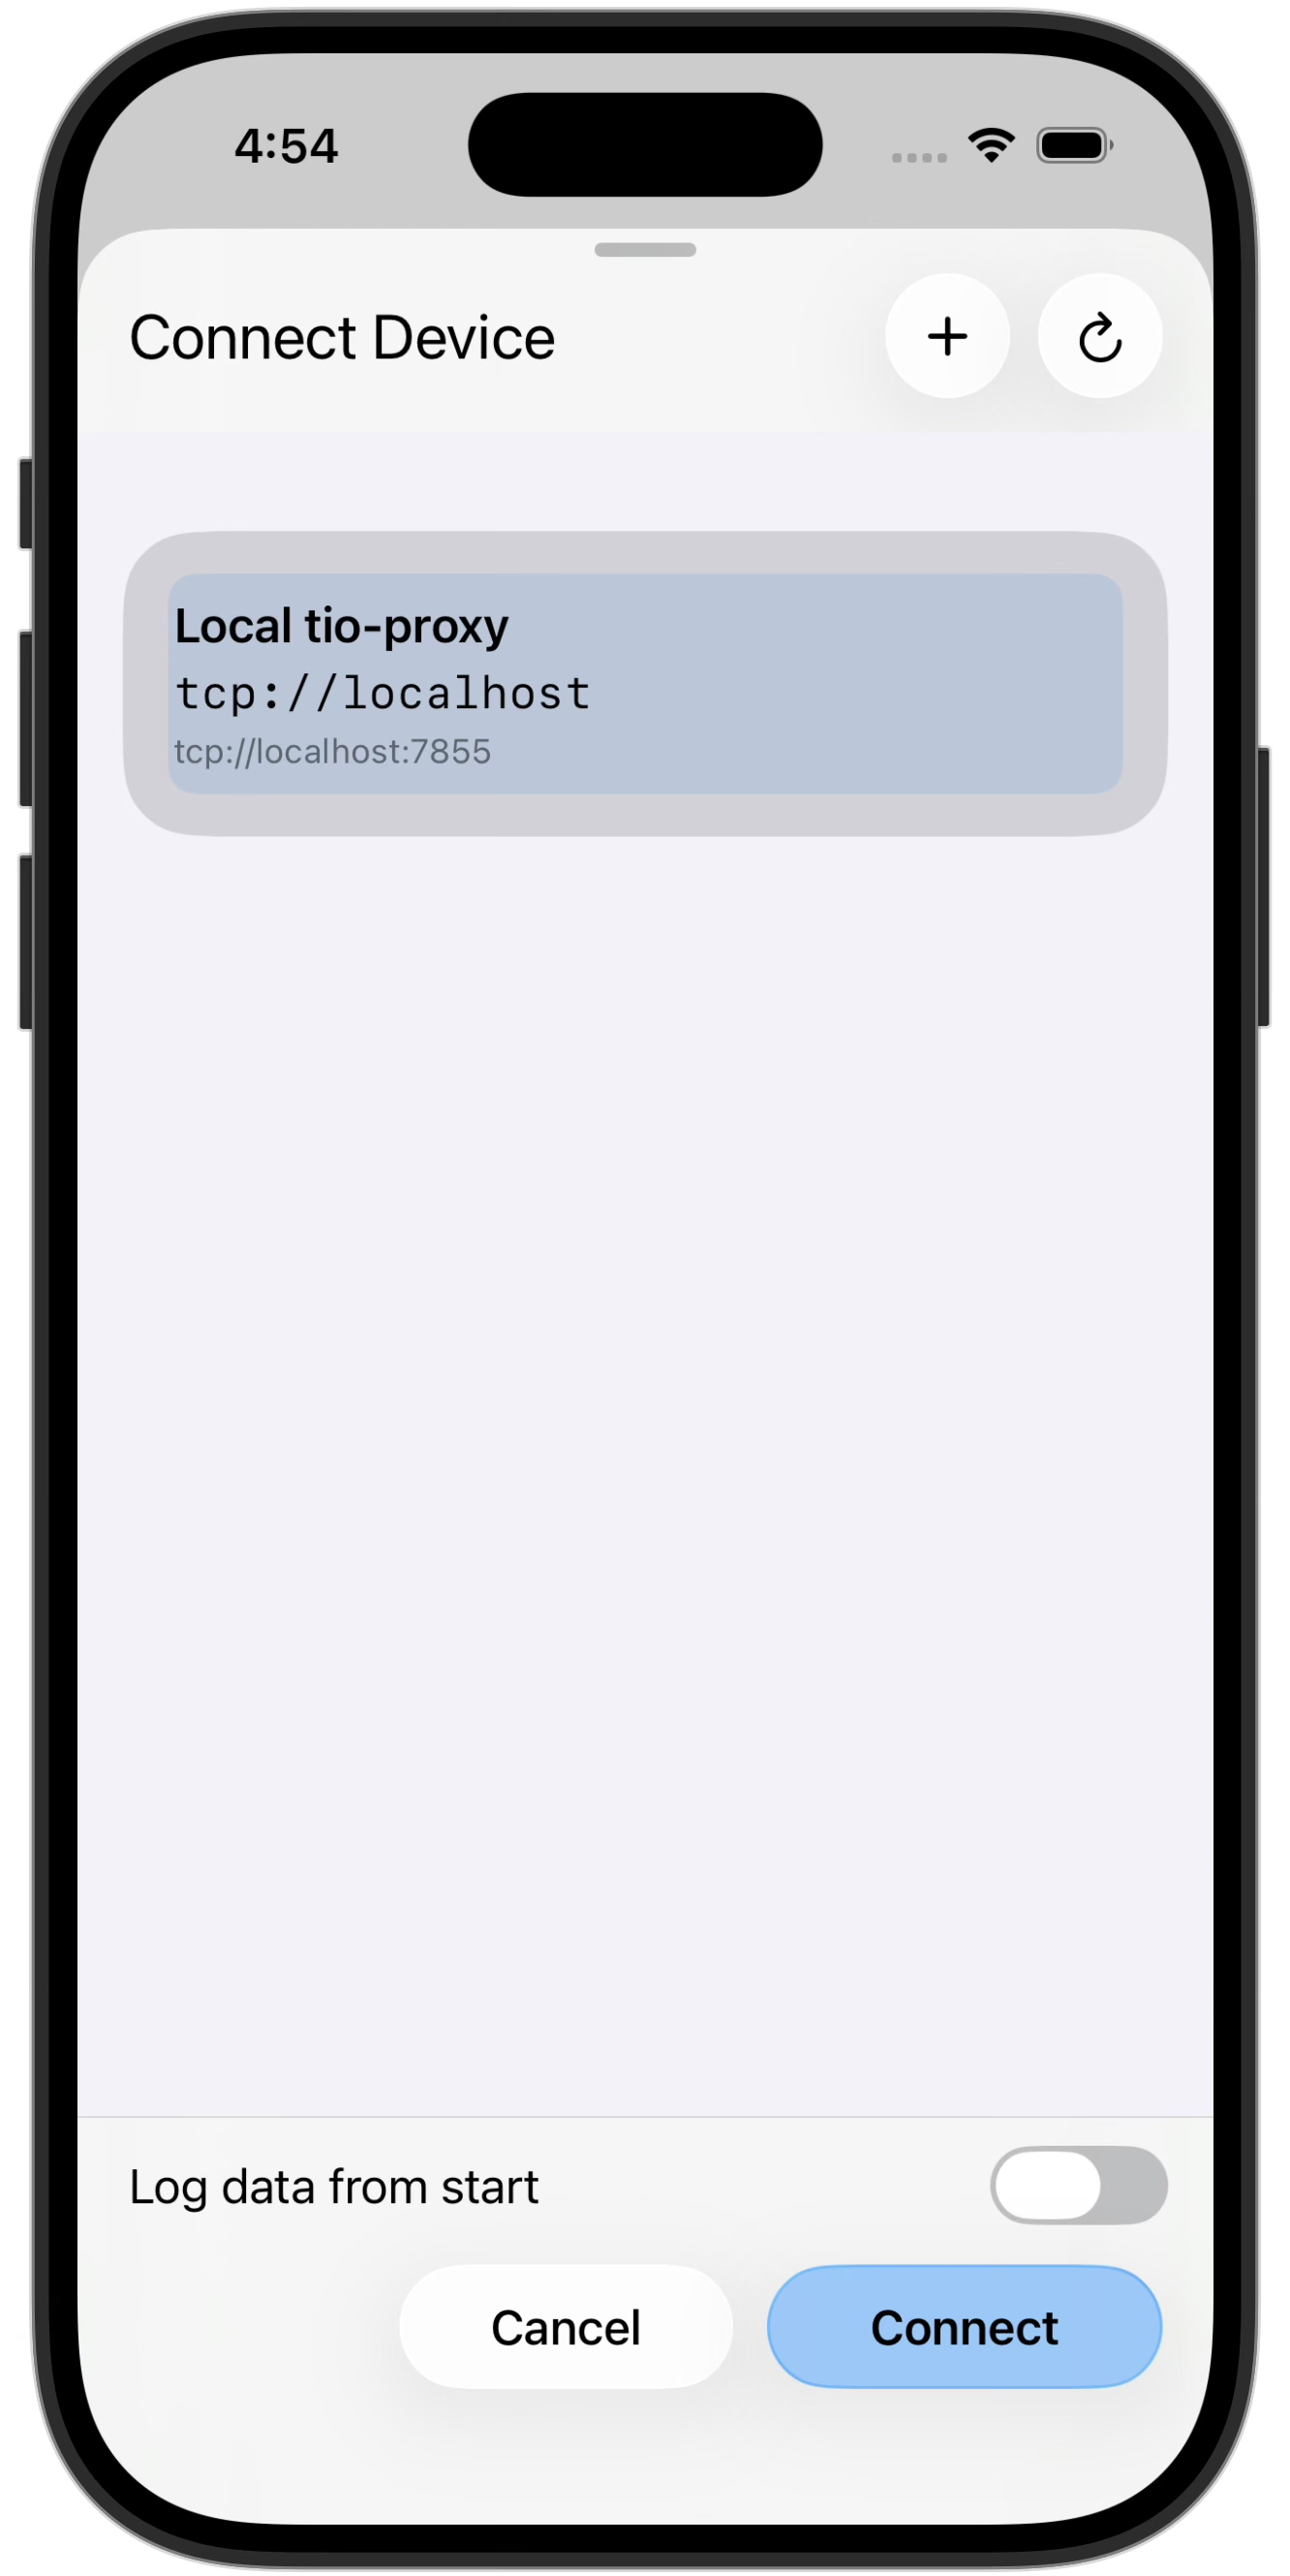
Connect
Connect to sensors via USB serial, TCP, and UDP. Remember favorite addresses.
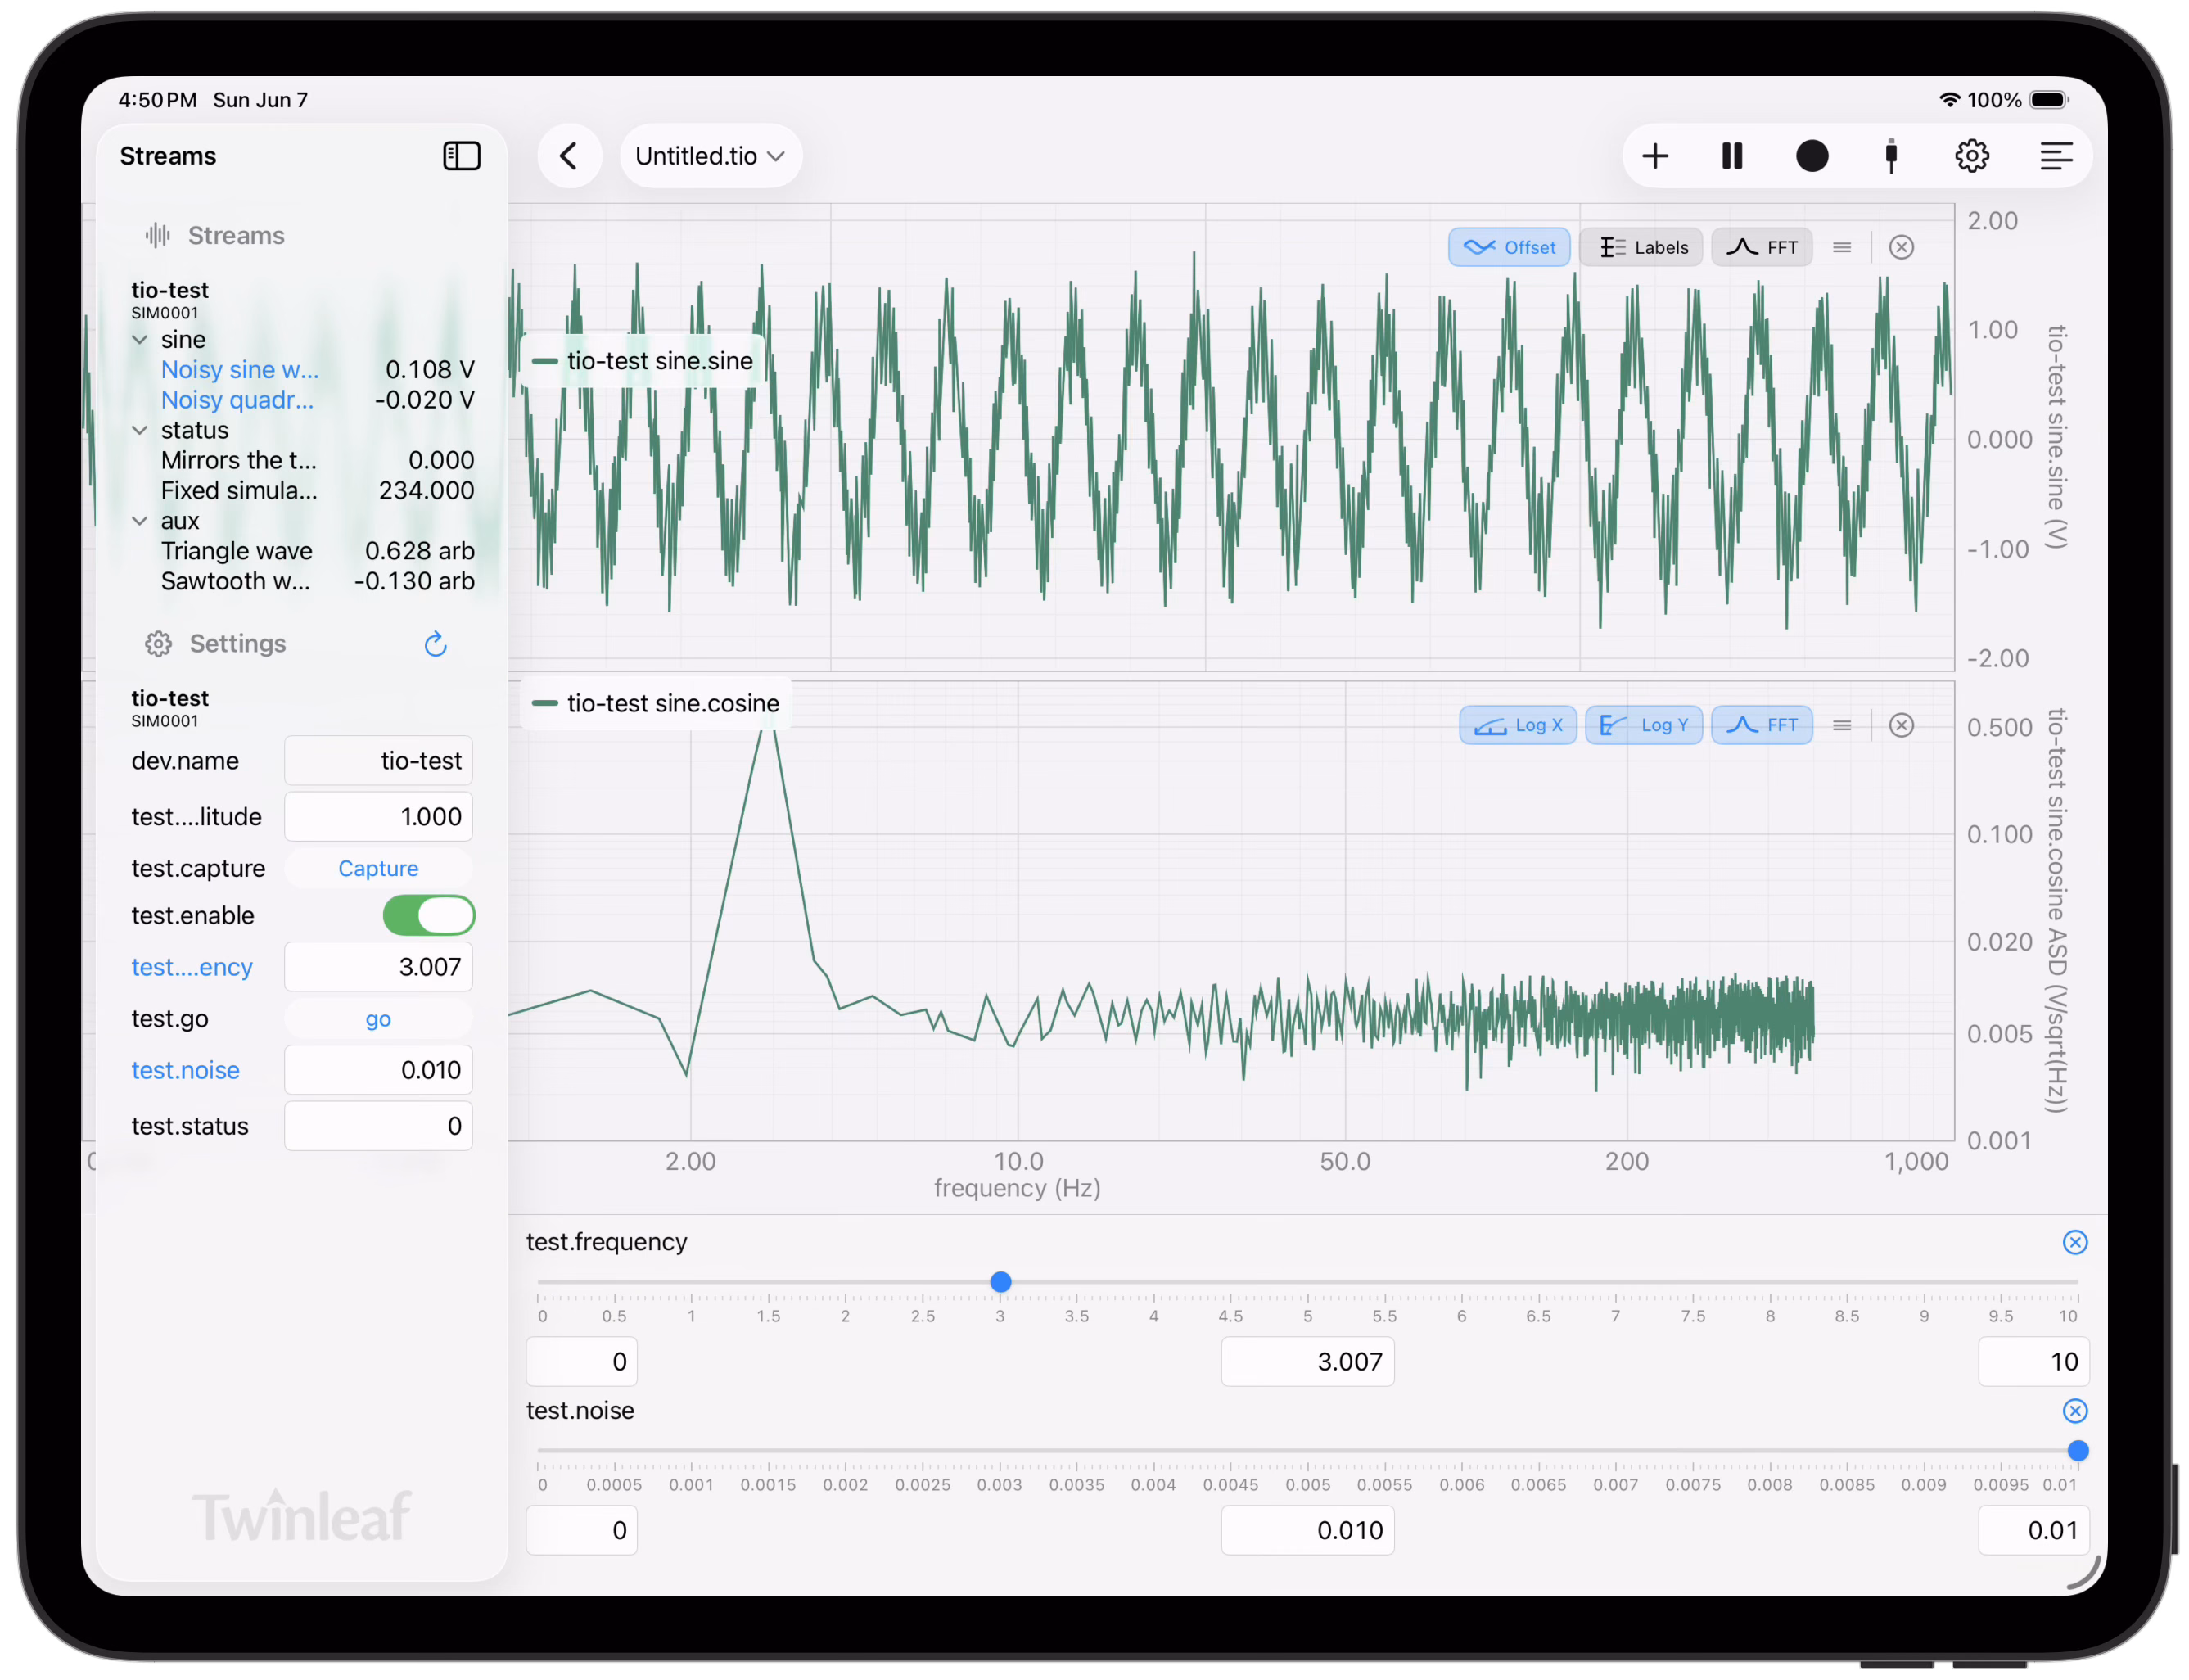
Multiple views
Stack plot views to keep an eye on more than one thing. Can be multiple streams from one sensor or multiple different sensors.
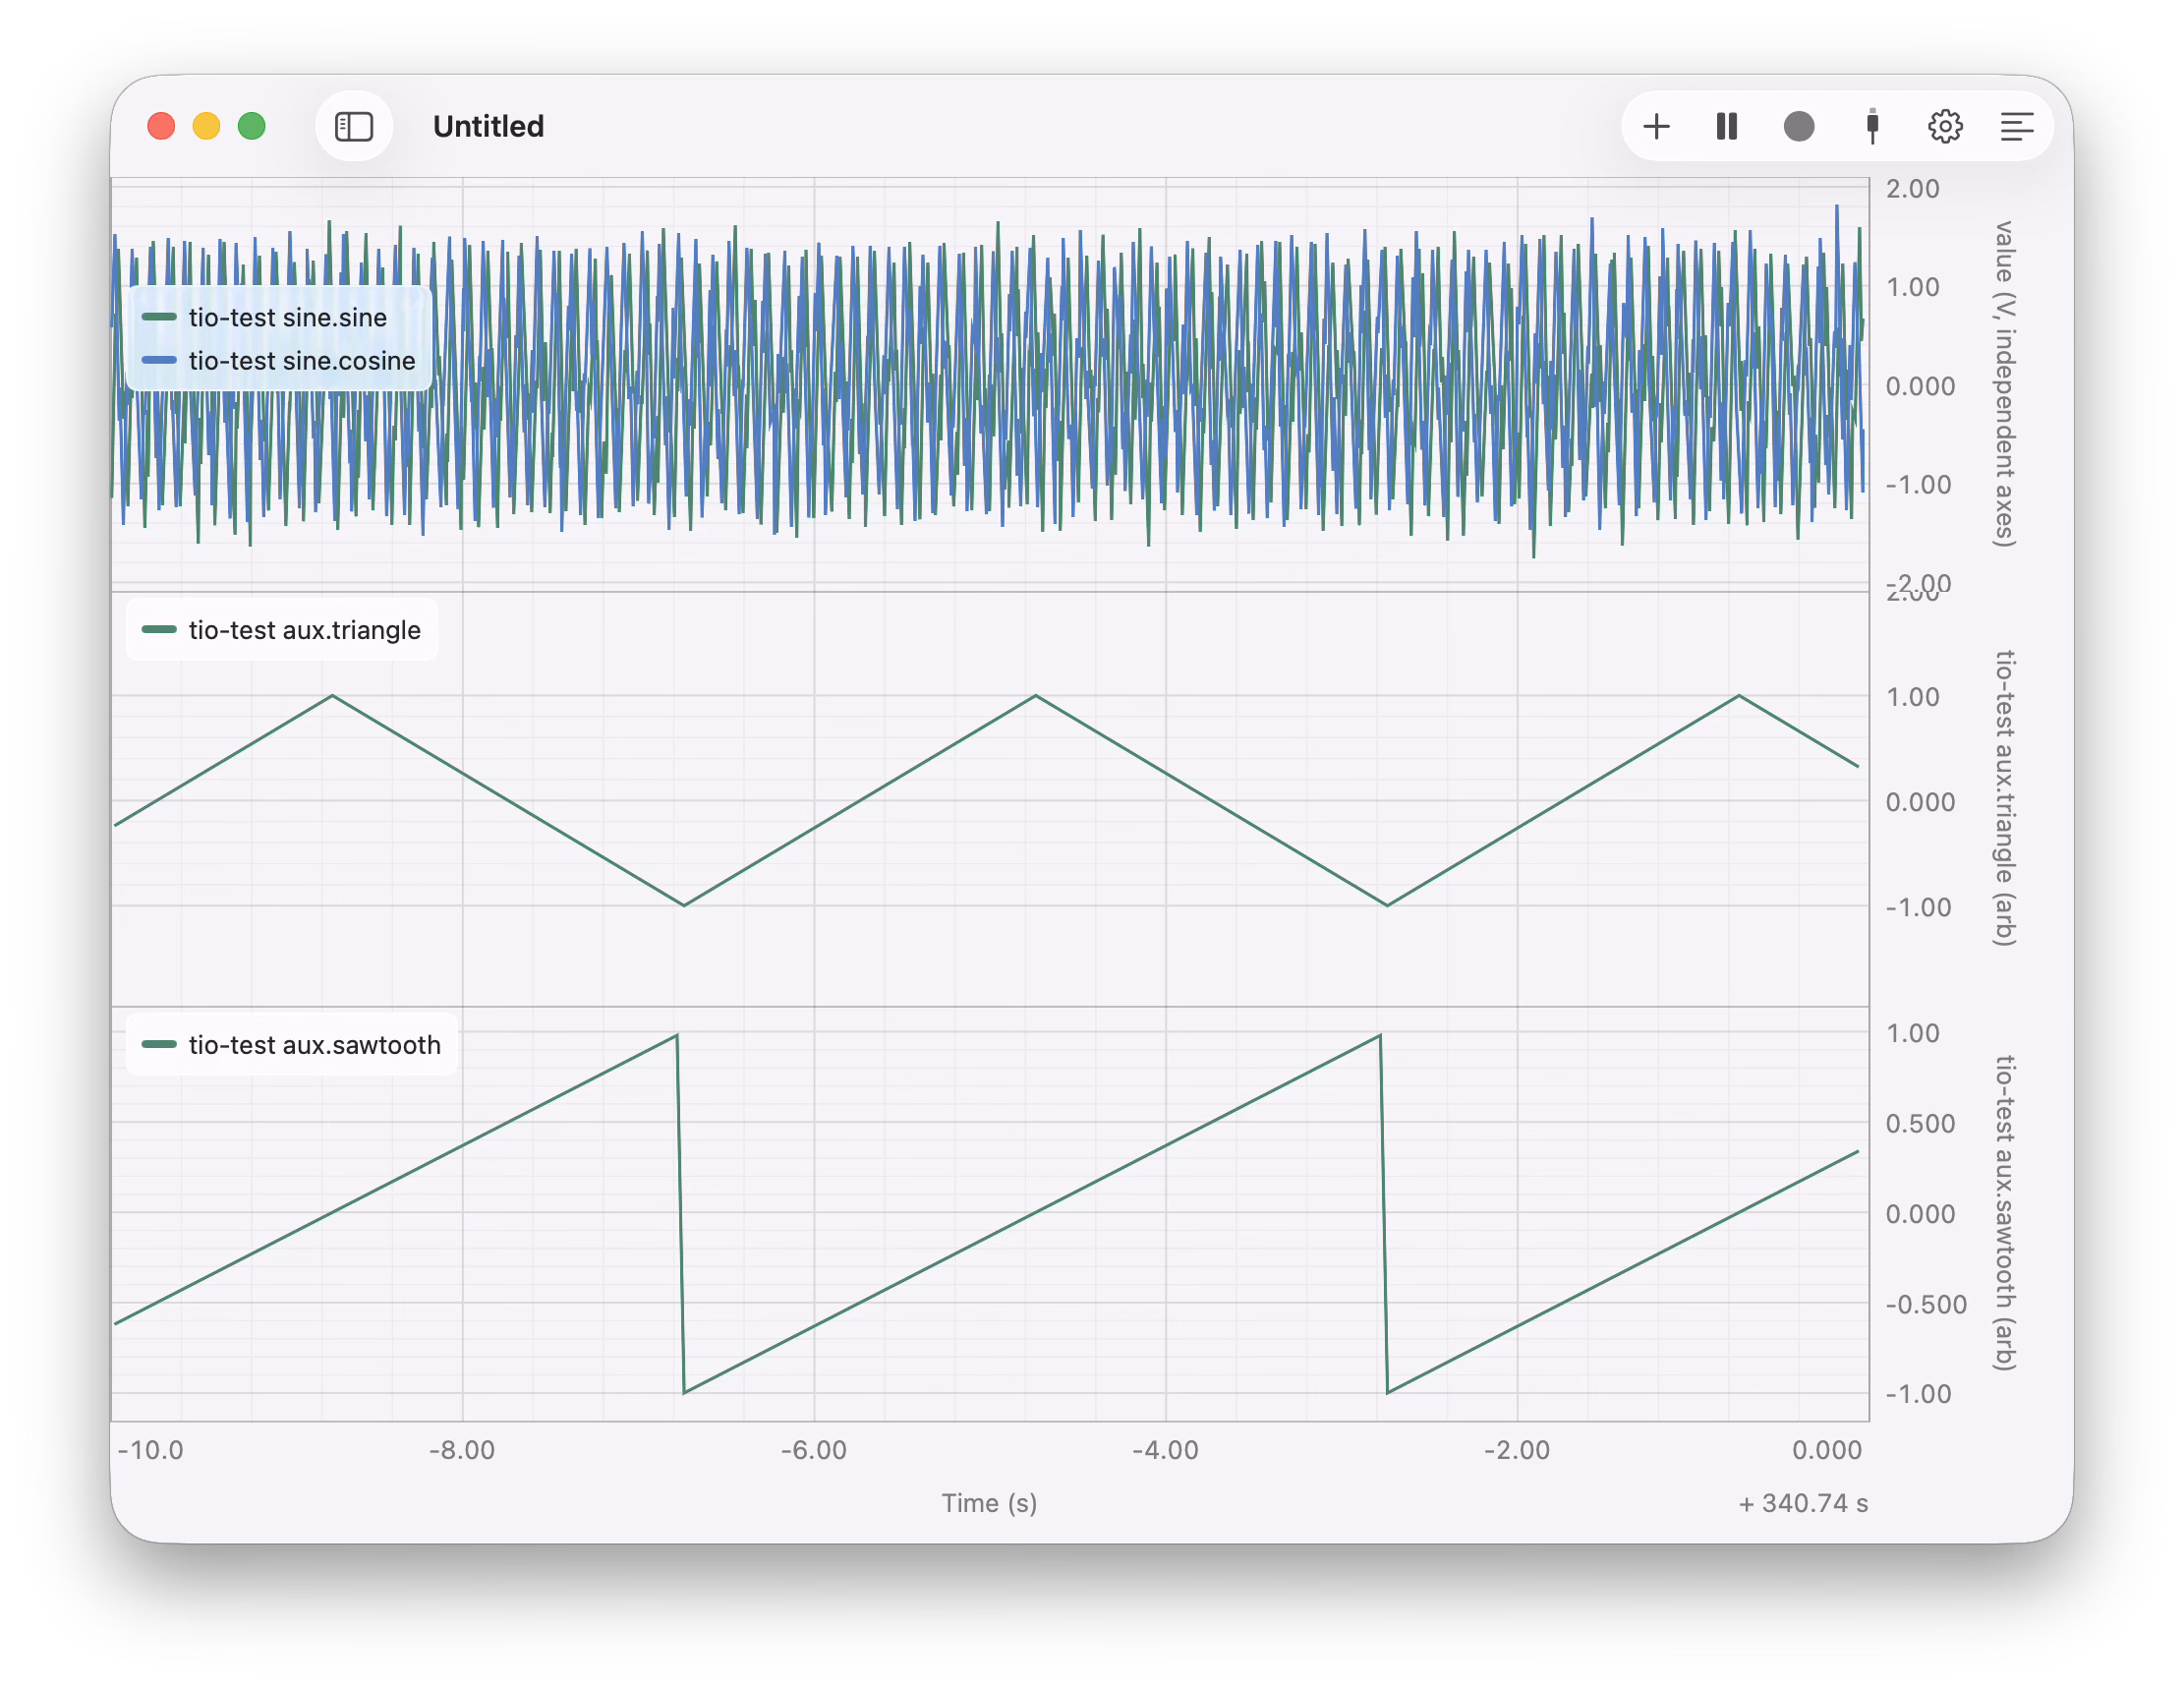
On macOS, break out extra windows and use multiple monitors.
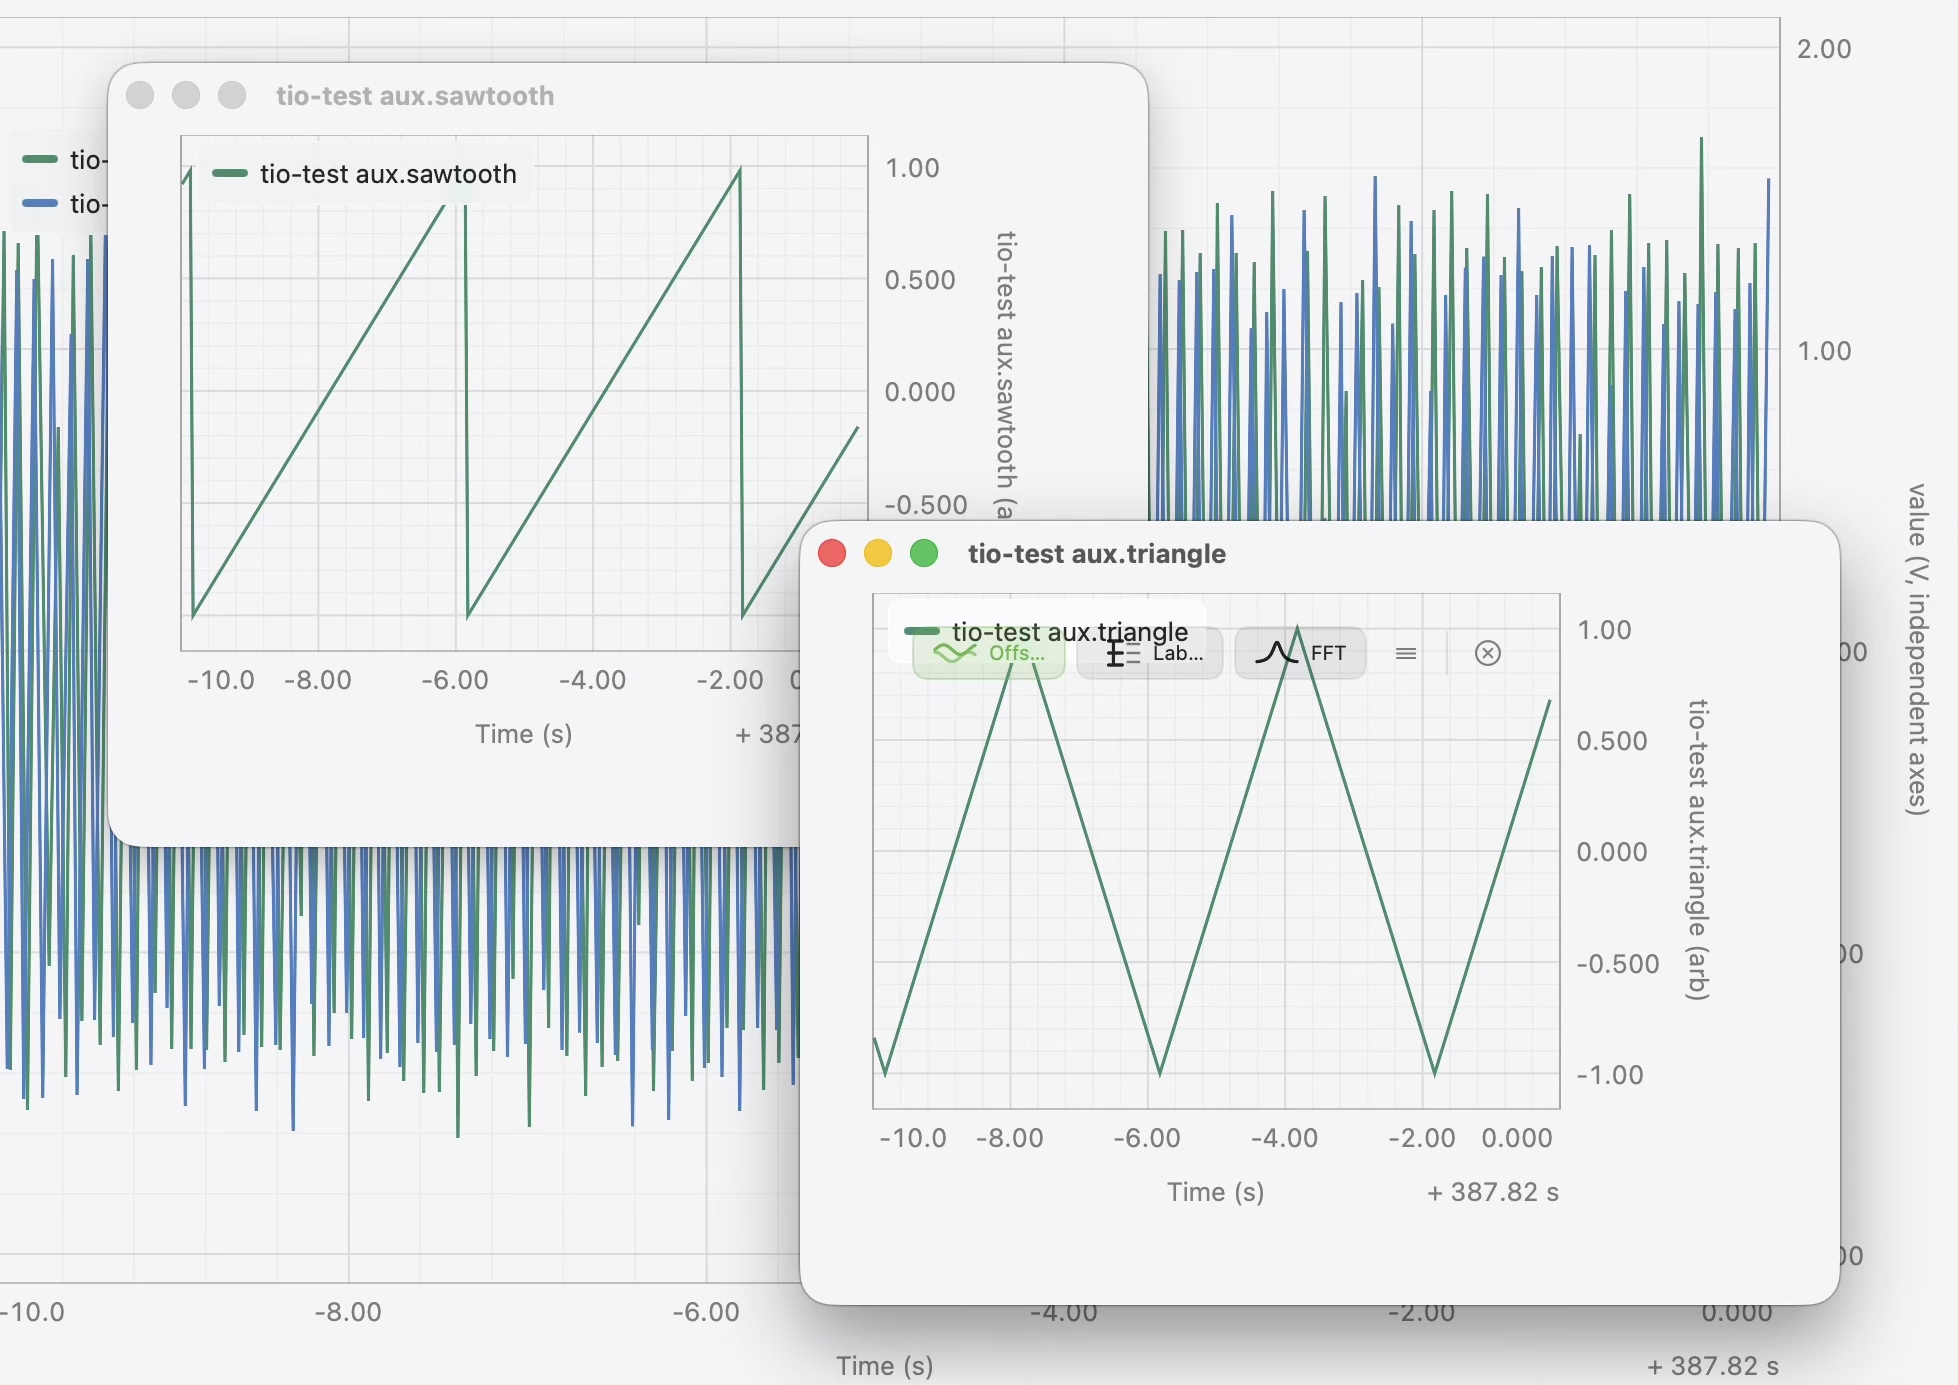
Frequency-domain view
Switch any pane into a live FFT.
Data access
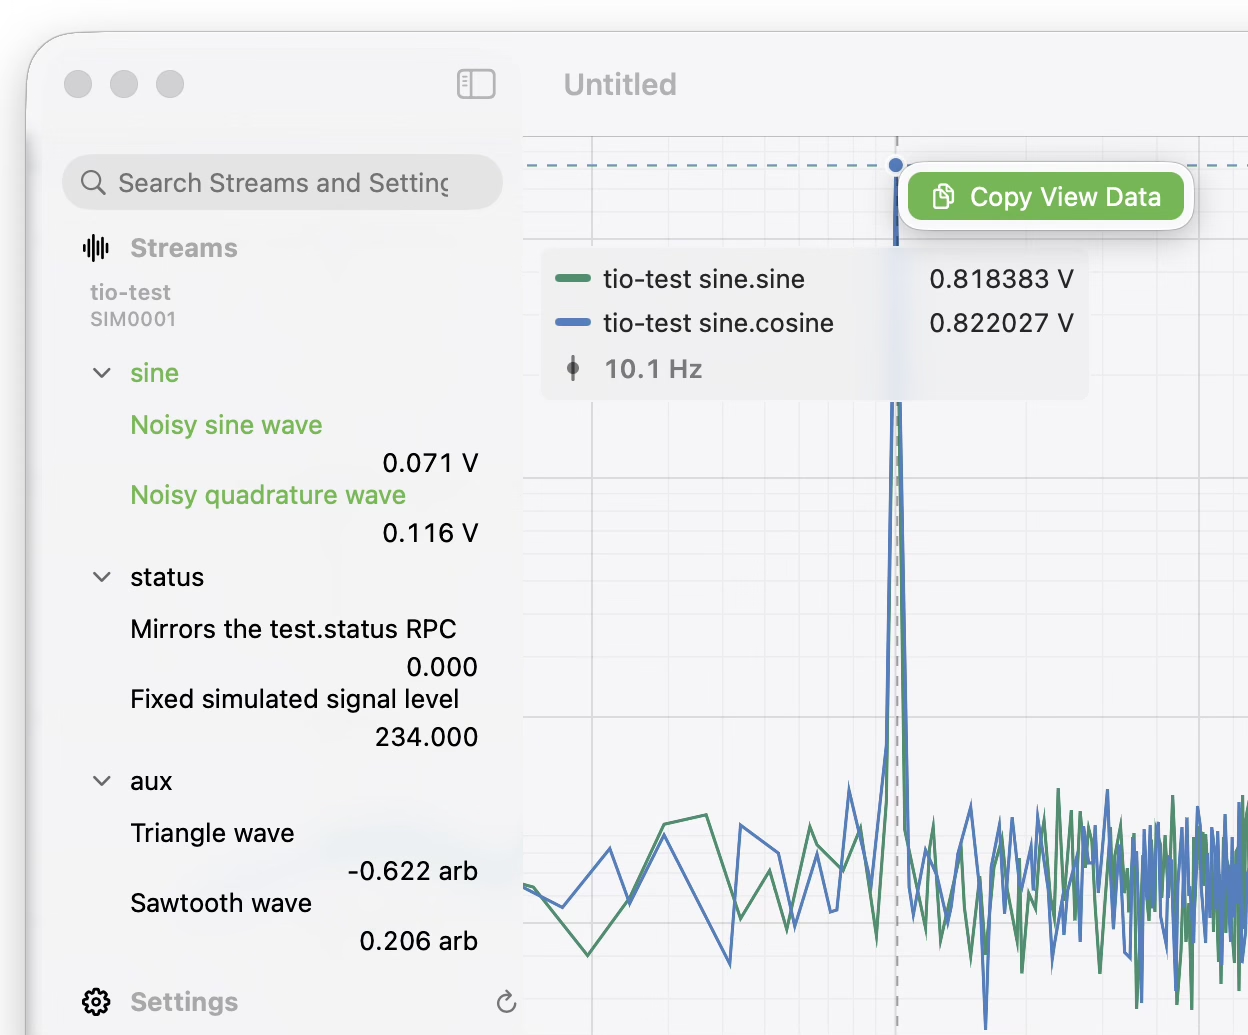
Hover the cursor over a plot to read exact values, timestamps, and per-channel statistics. Right-click (two-finger click) to copy csv data from the plot.
Distraction-free
Tuck the sidebars away and let the data take the whole window when you just want to watch the signal.
iPad
Adjust settings with touch controls!
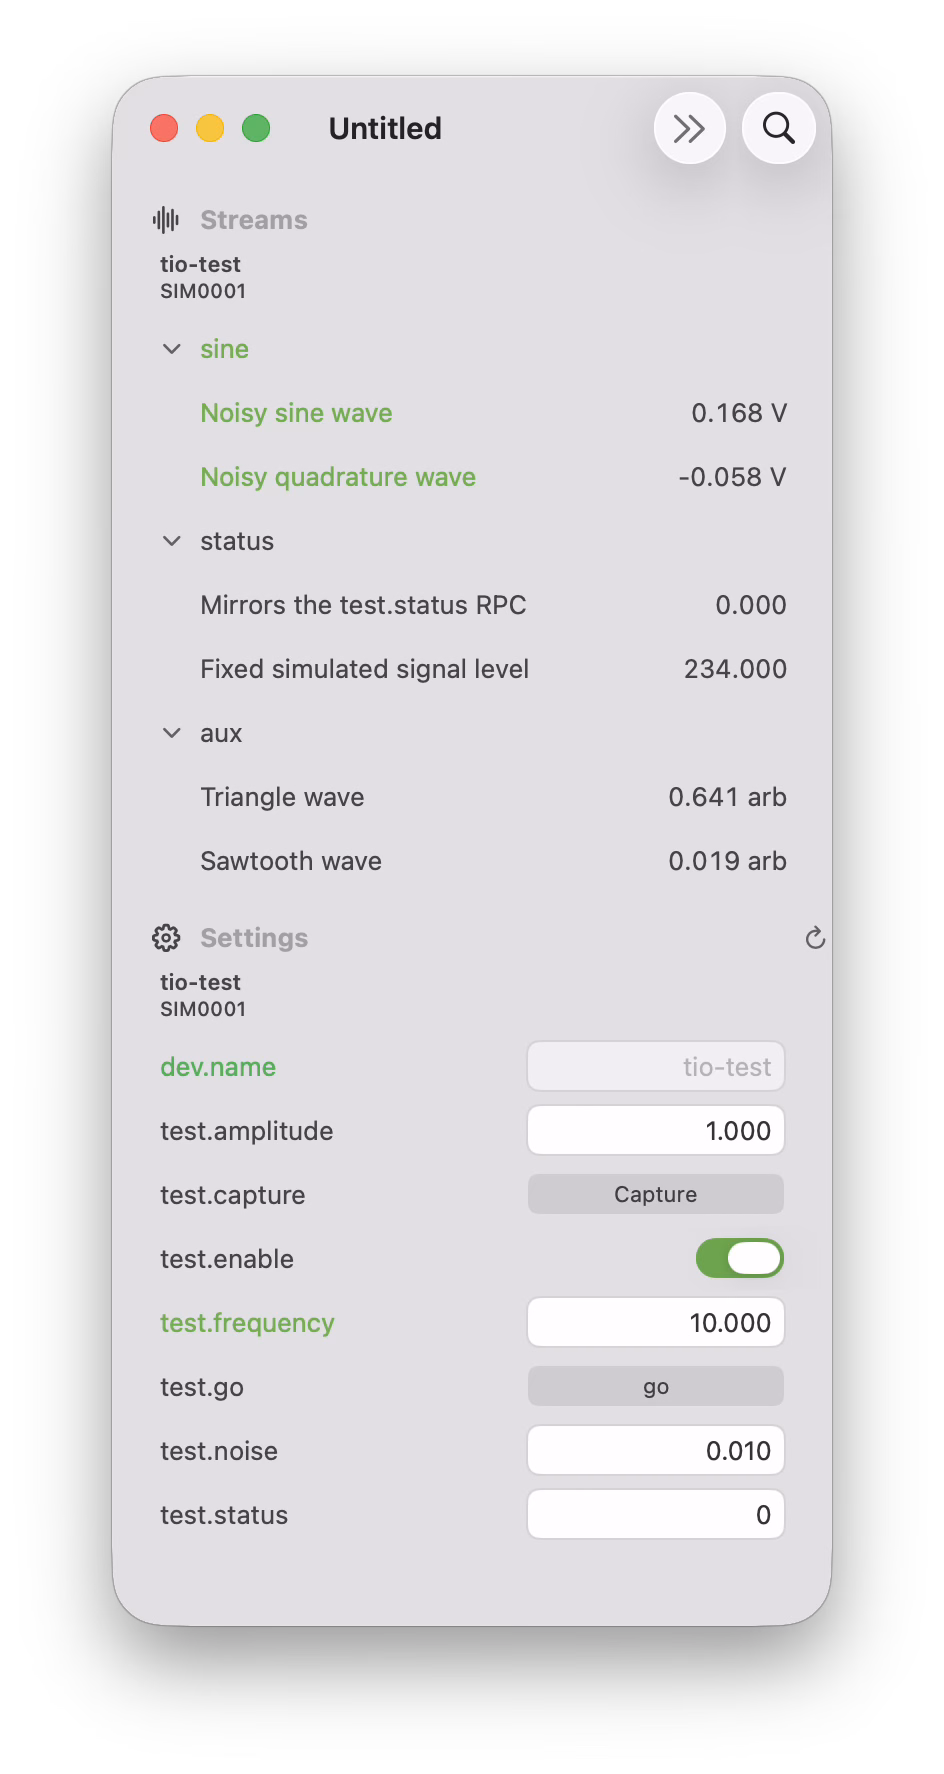
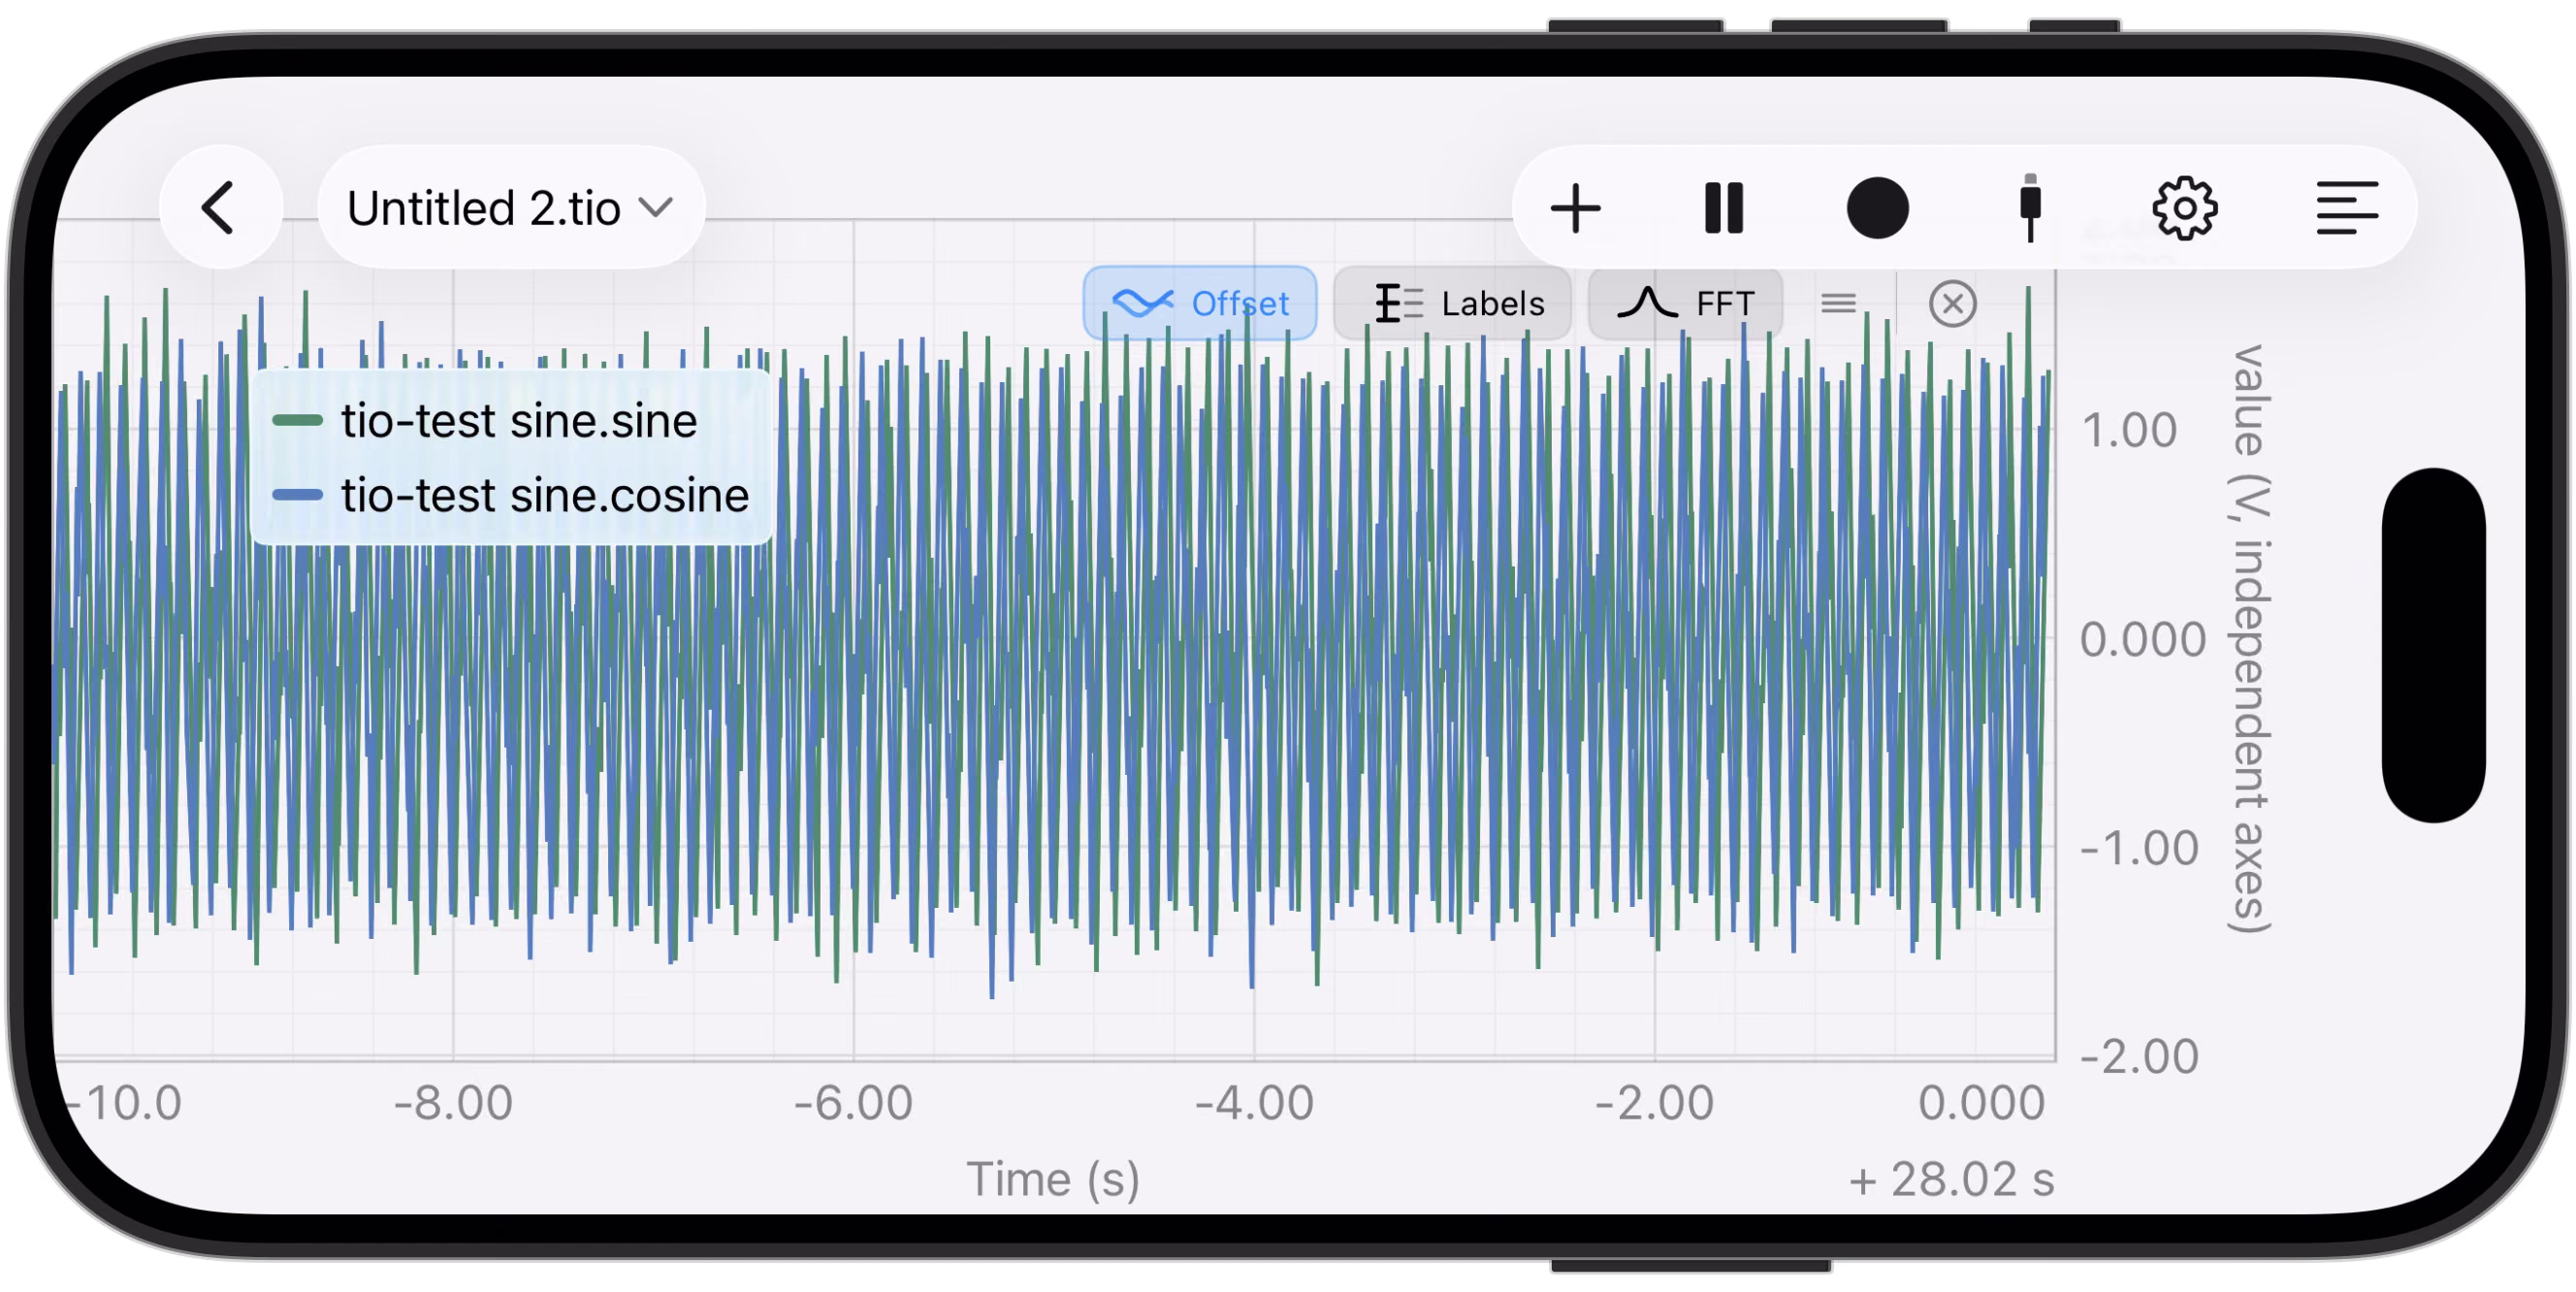
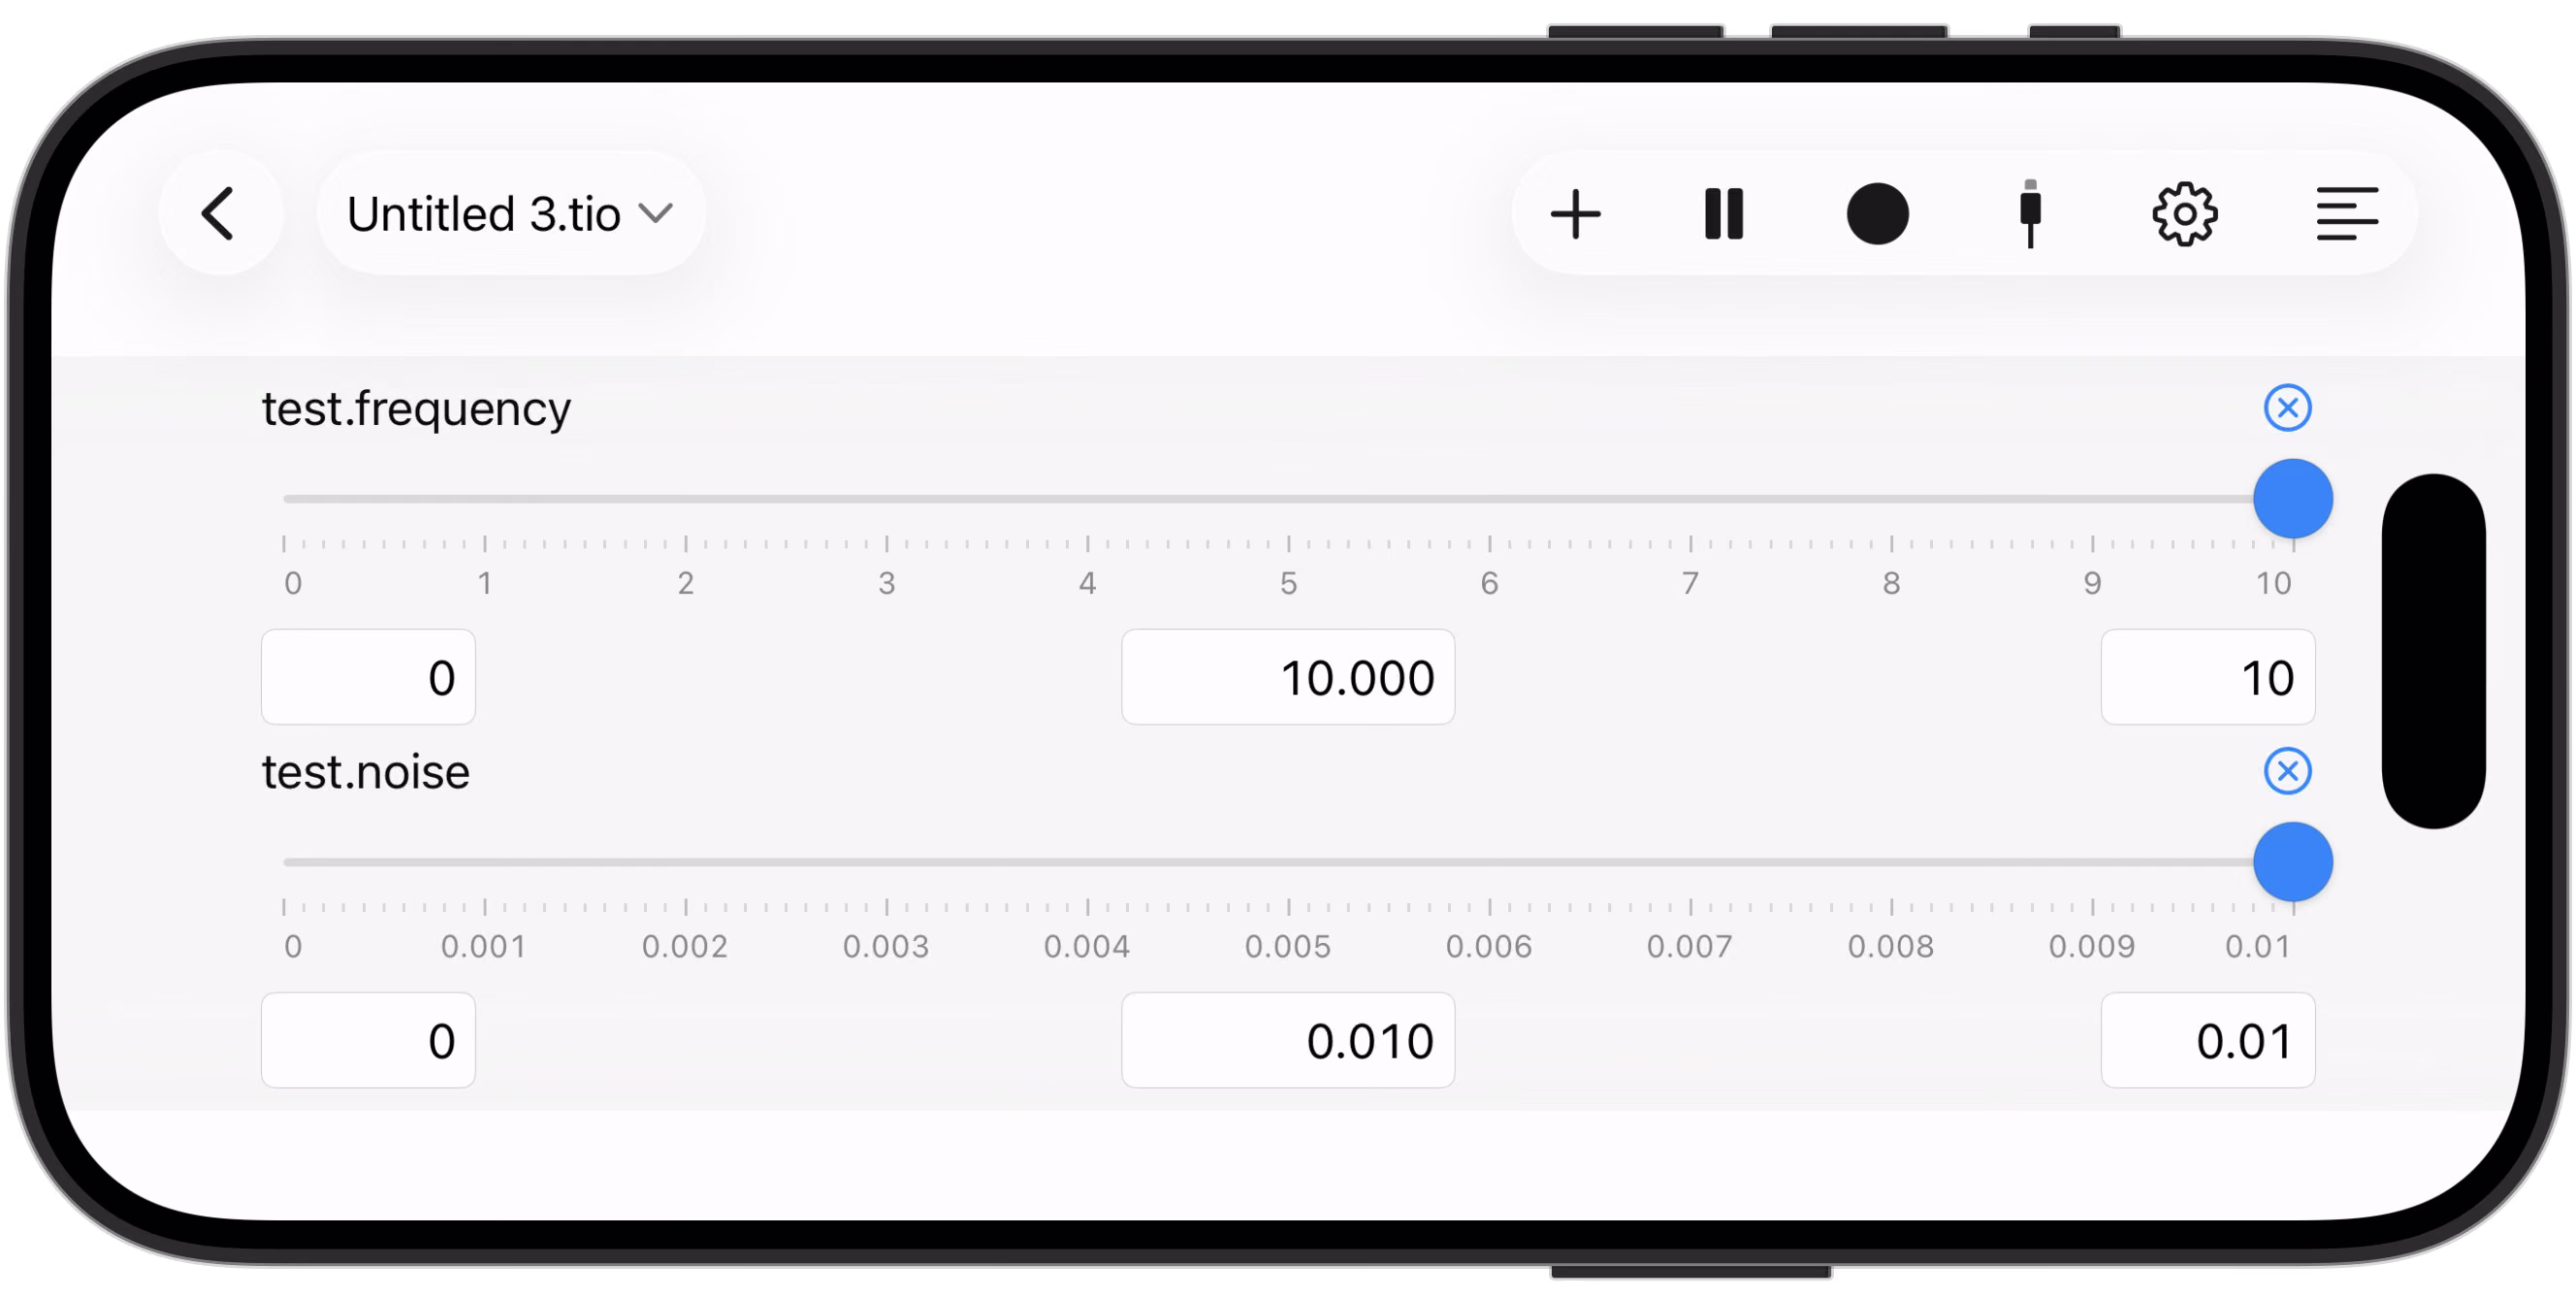
iPhone
Also on iPhone!
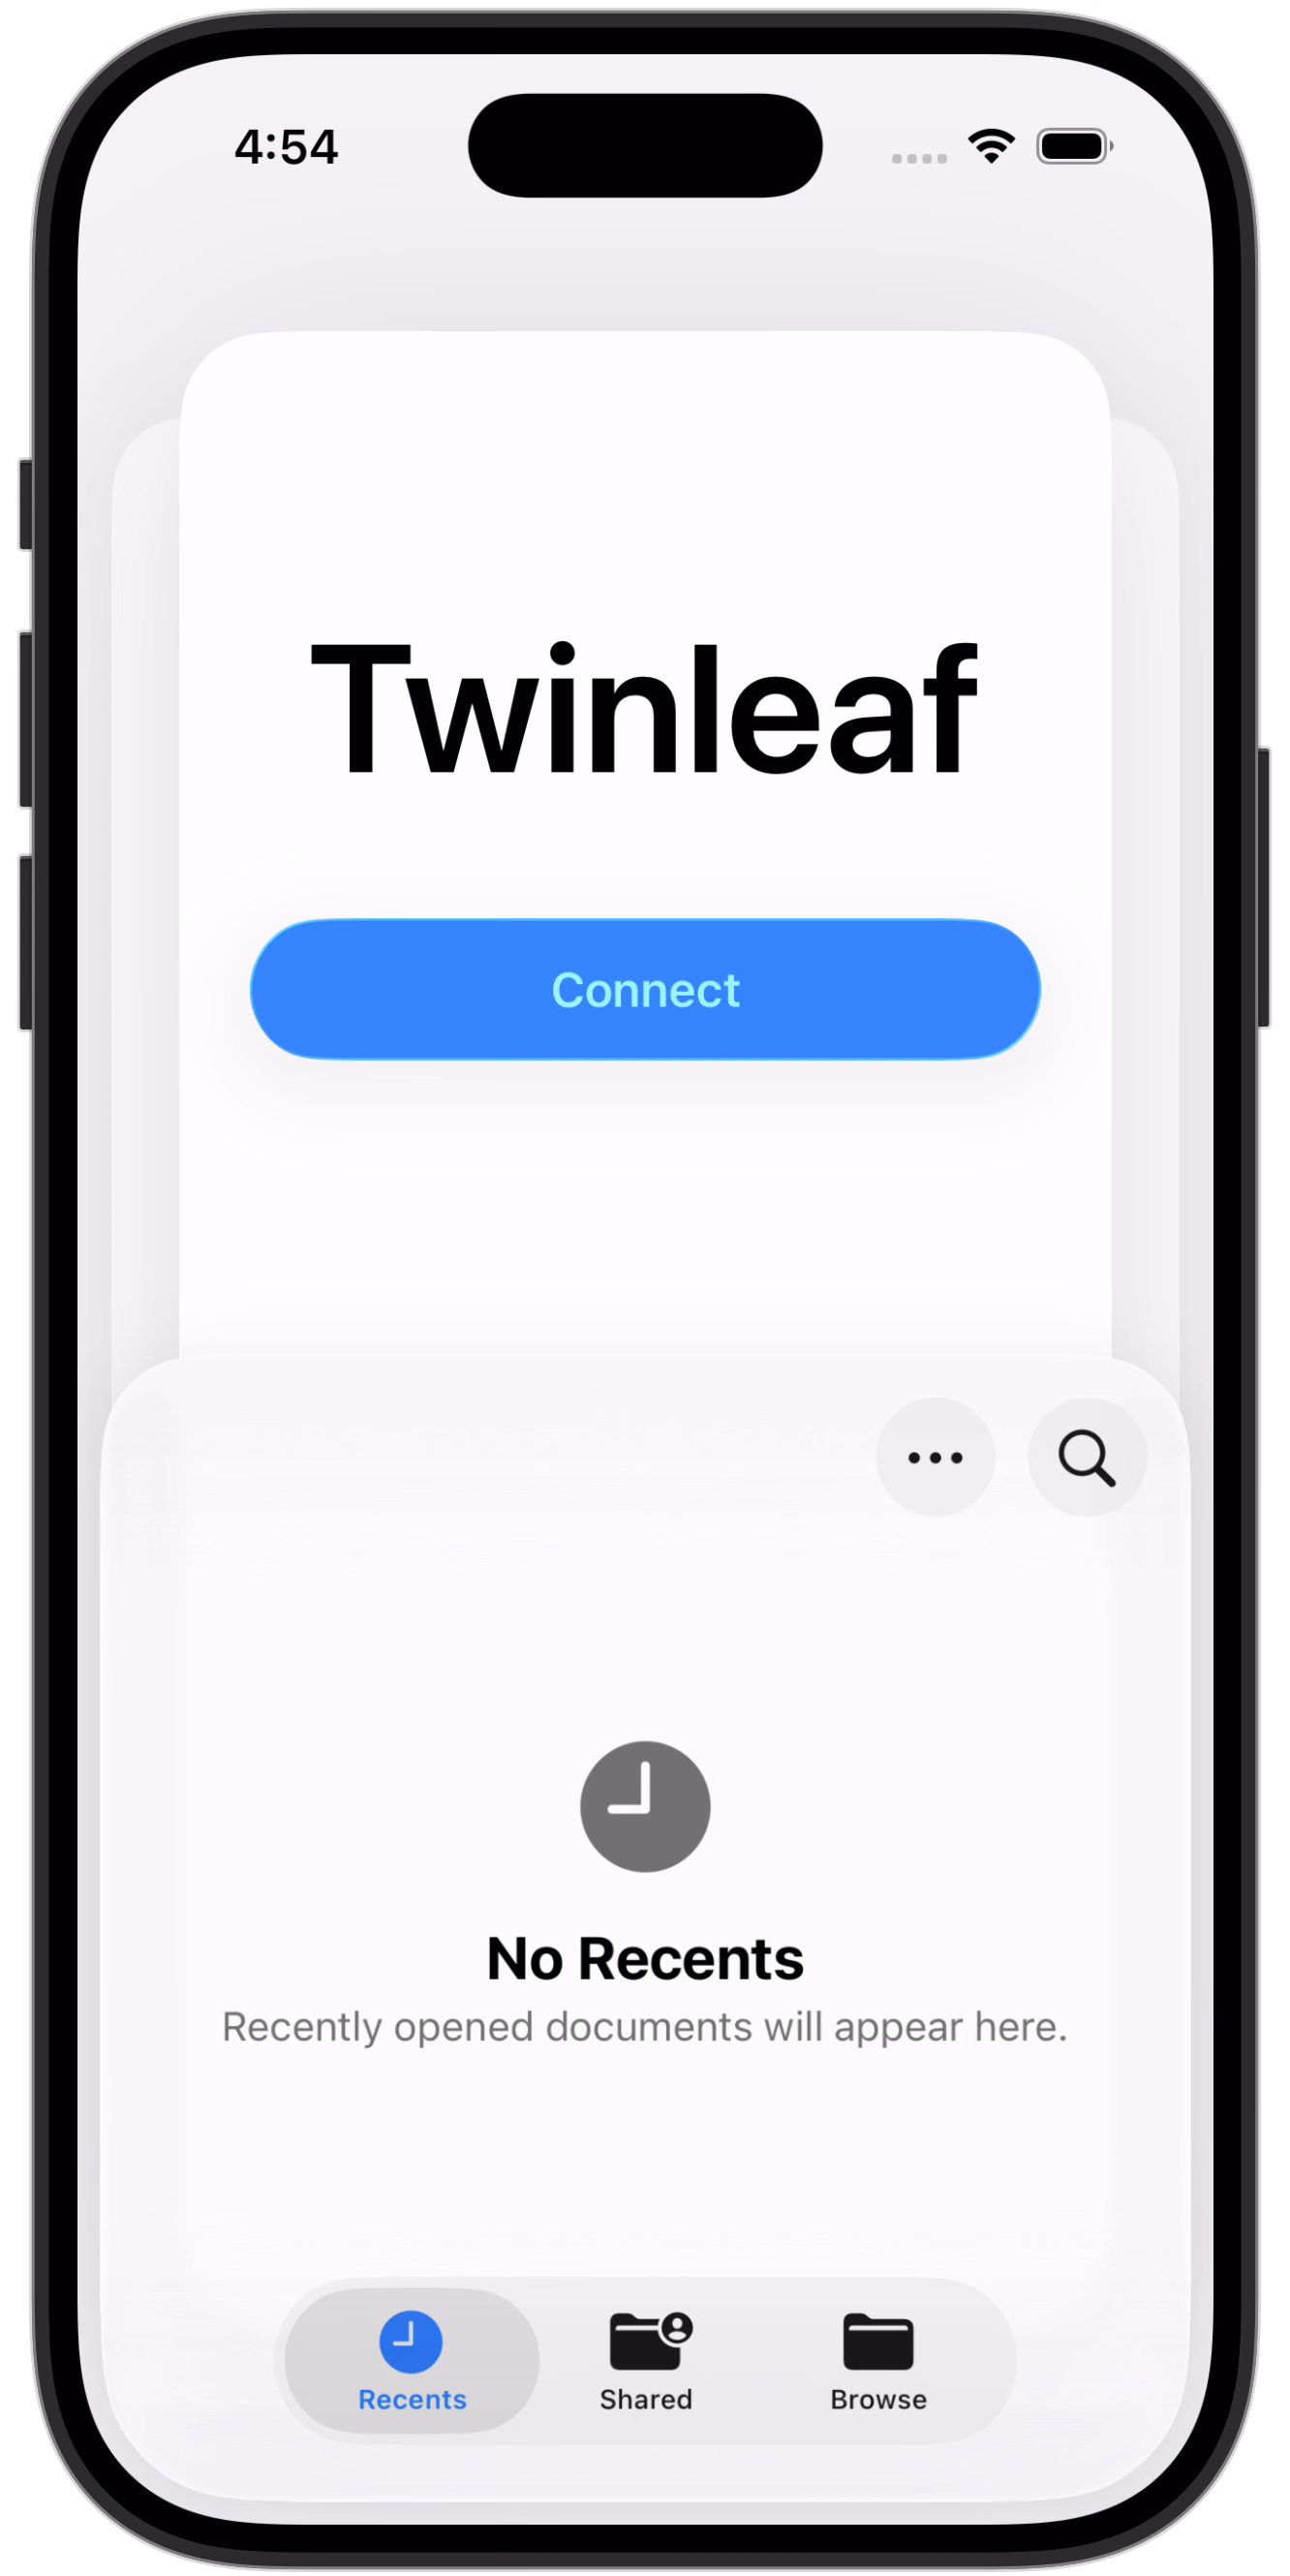
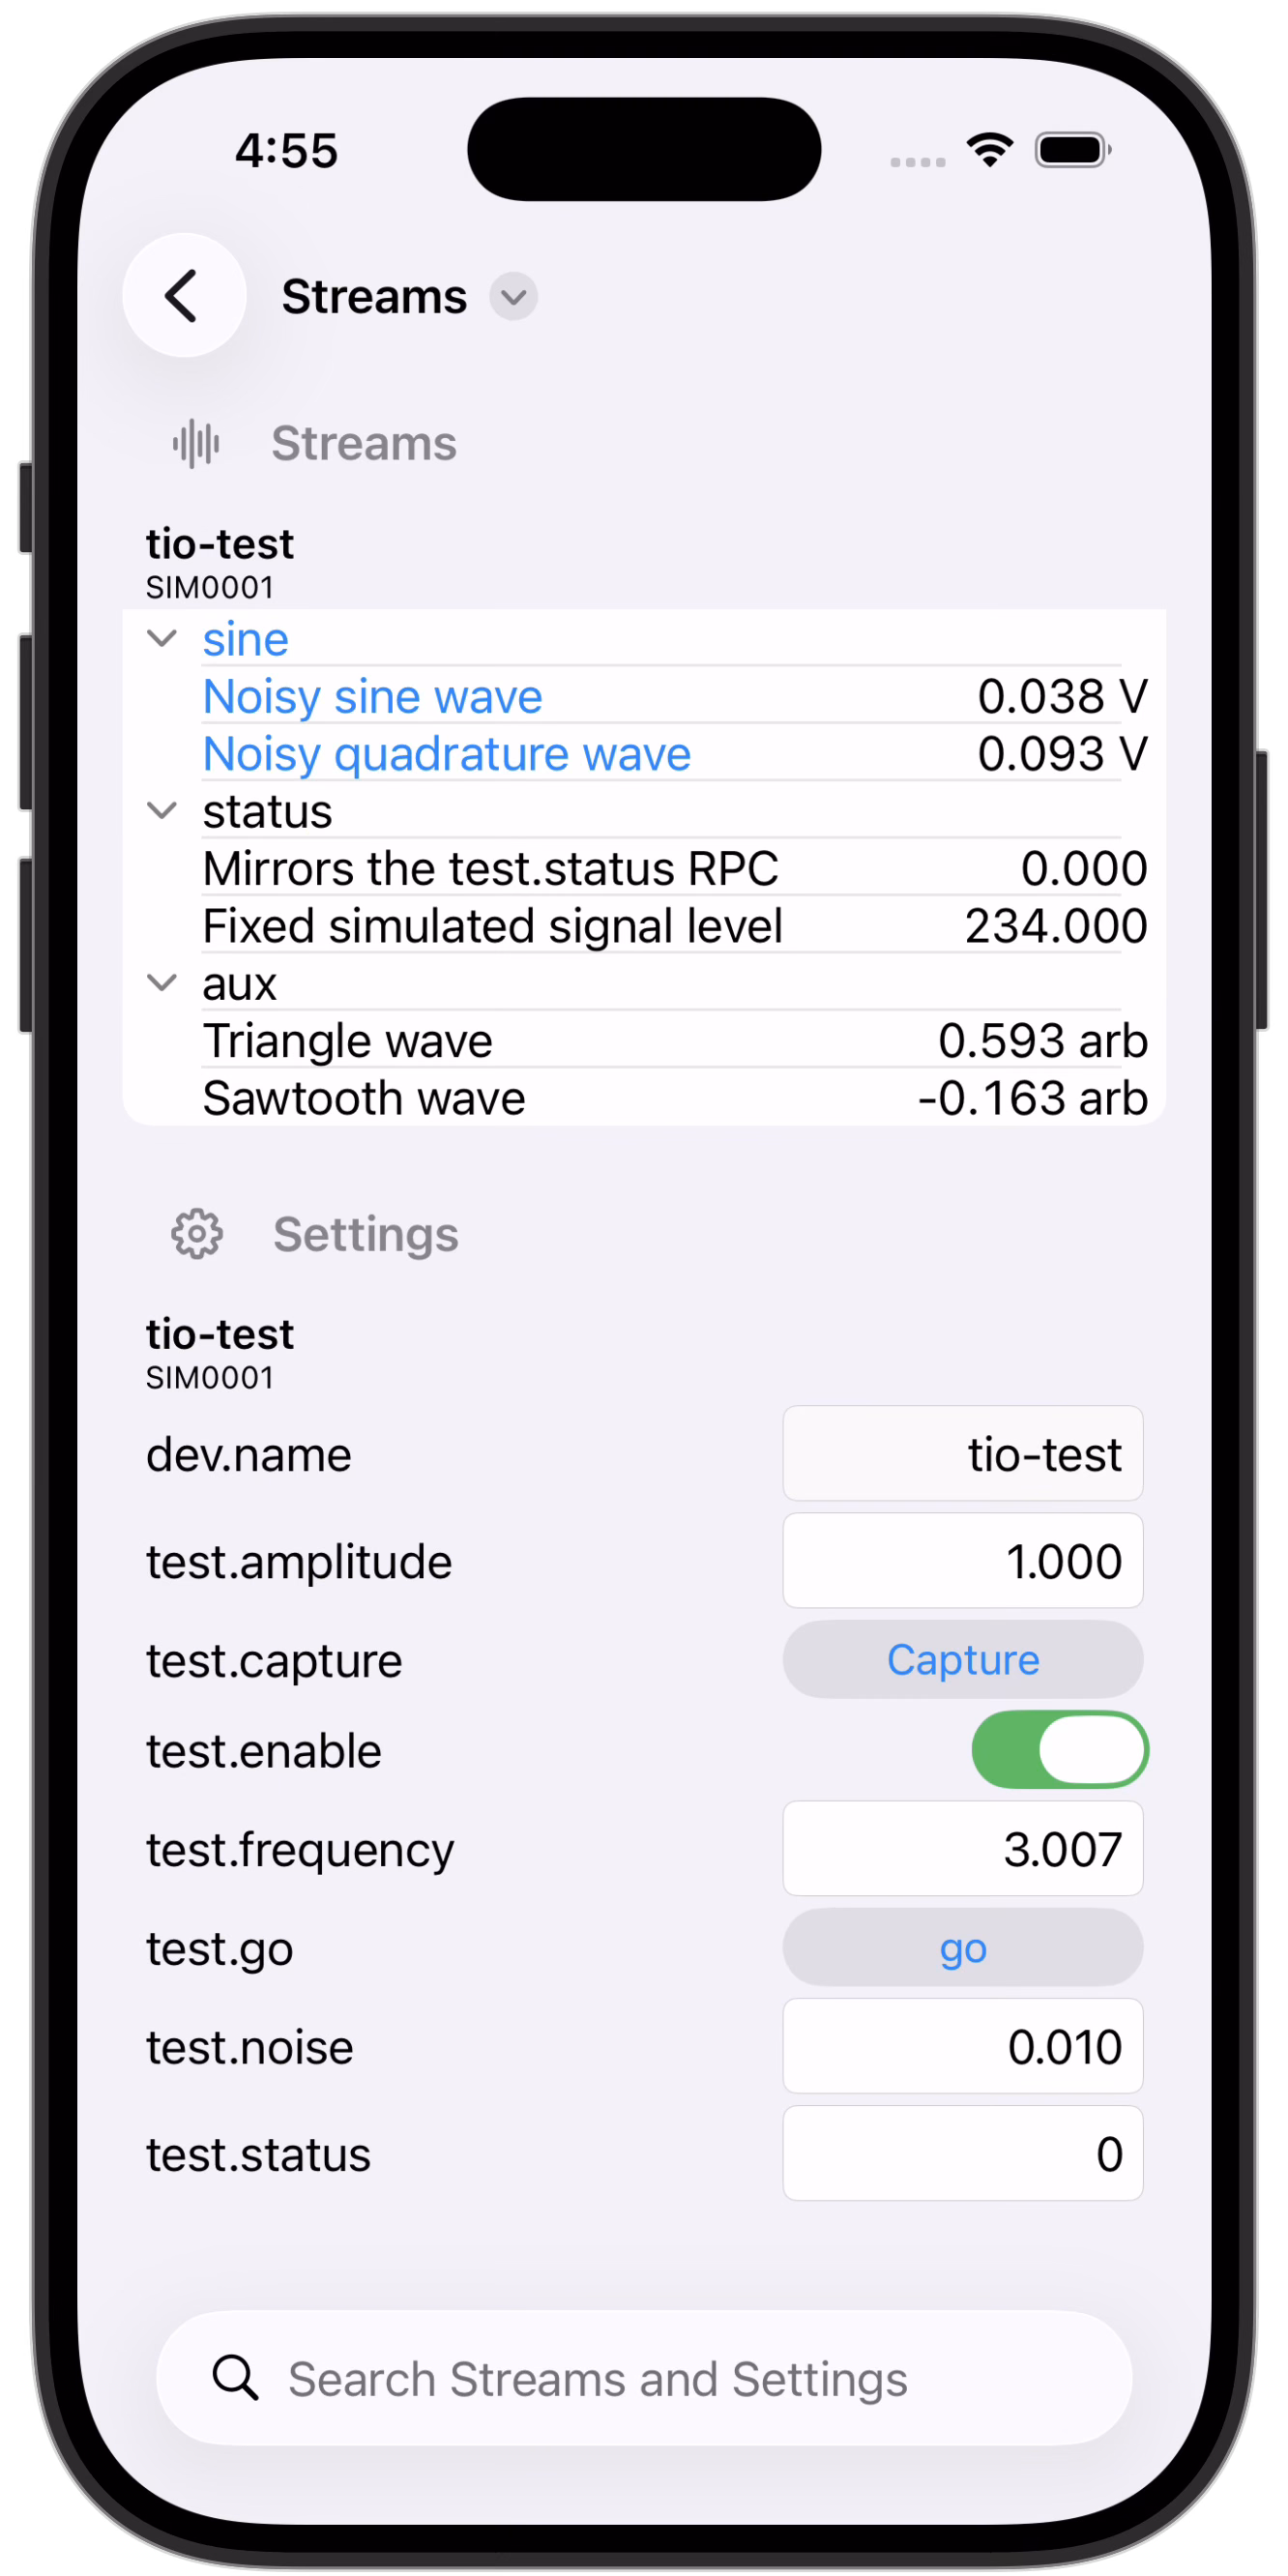
Rotate to landscape for a full-screen graph, or drive settings with large touch sliders.
Open source
The Twinleaf App is free and open source, like the rest of our software stack. The sensors communicate using the TIO protocol. It builds on the Rust tools that drive our Python and command-line utilities. You can use, extend, or learn from any of it.